
Figure 7—figure supplement 1—source data 1.
- ID
- ZDB-FIG-230818-41
- Publication
- Hagio et al., 2023 - Optogenetic manipulation of neuronal and cardiomyocyte functions in zebrafish using microbial rhodopsins and adenylyl cyclases
- Other Figures
-
- Figure 1—figure supplement 1—source data 1.
- Figure 1—figure supplement 1—source data 1.
- Figure 2—video 1.
- Figure 3—figure supplement 1—source data 1.
- Figure 3—figure supplement 1—source data 1.
- Figure 3—figure supplement 2—source data 1.
- Figure 3—figure supplement 3—source data 1.
- Figure 4—video 1.
- Figure 5—figure supplement 1—source data 1.
- Figure 5—figure supplement 1—source data 1.
- Figure 5—figure supplement 2—source data 1.
- Figure 6—video 1.
- Figure 7—figure supplement 1—source data 1.
- Figure 7—figure supplement 1—source data 1.
- Figure 7—figure supplement 2—source data 1.
- All Figure Page
- Back to All Figure Page
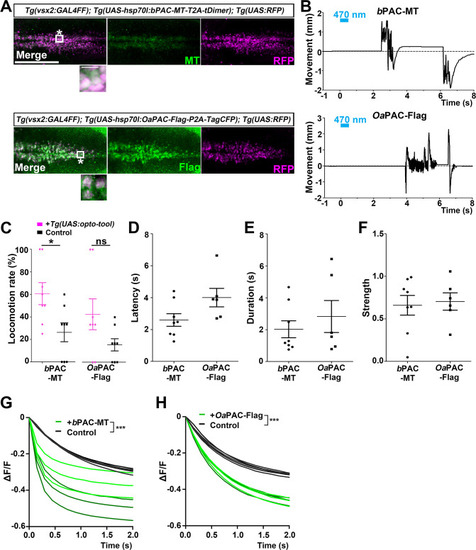
The hindbrain of 3-dpf larvae expressing |