
- Title
-
Optogenetic manipulation of Gq- and Gi/o-coupled receptor signaling in neurons and heart muscle cells
- Authors
- Hagio, H., Koyama, W., Hosaka, S., Song, A.D., Narantsatsral, J., Matsuda, K., Sugihara, T., Shimizu, T., Koyanagi, M., Terakita, A., Hibi, M.
- Source
- Full text @ Elife
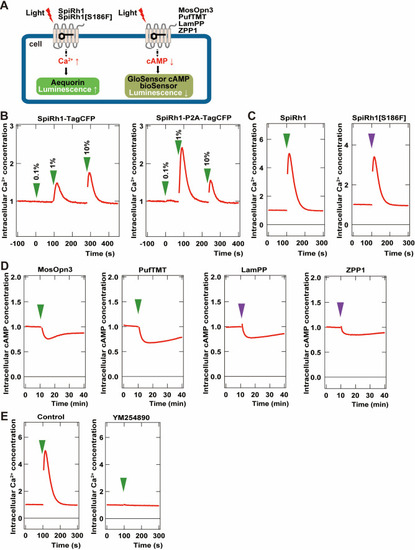
Activity of G-coupled bistable rhodopsins in HEK293S cells. ( |
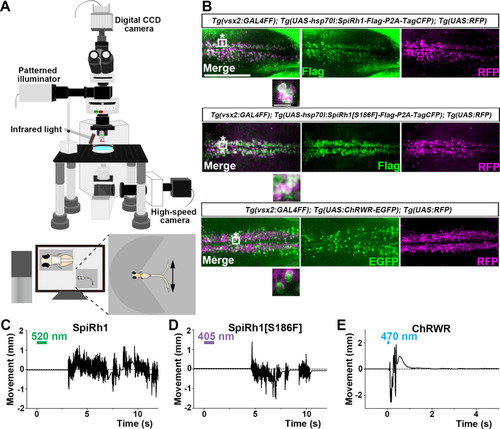
Activation of reticulospinal V2a neurons by Gq-coupled bistable rhodopsins. (A) Schematic of experimental devices for induction of swimming behavior and a larva embedded in agarose. The hindbrain region was irradiated with light by using a patterned illuminator. Tail (caudal fin) movements were monitored by a high-speed camera with infrared light. (B) Expression of SpiRh1, SpiRh1[S186F], and channel rhodopsin wide receiver (ChRWR) in hindbrain reticulospinal V2a neurons. 3-dpf (days post fertilization) Tg(vsx2:GAL4FF);Tg(UAS-hsp70l:SpiRh1-Flag-P2A-TagCFP, myl7:mCherry);Tg(UAS:RFP), Tg(vsx2:GAL4FF);Tg(UAS-hsp70l:SpiRh1[S186F]-Flag-P2A-TagCFP, myl7:mCherry);Tg(UAS:RFP) and Tg(vsx2:GAL4FF);Tg(UAS:ChRWR-EGFP);Tg(UAS:RFP) larvae were fixed and stained with anti-Flag or anti-GFP (EGFP, green), and anti-DsRed (RFP, magenta) antibodies. Inset: higher magnification views of the boxed areas showing double-labeled neurons. (C, D, E) Tail movements of 3-dpf Tg larvae expressing SpiRh1 (C), SpiRh1 [S186F] (D), and ChRWR (E) in the reticulospinal V2a neurons after light stimulation. The hindbrain area was stimulated with light (0.4 mW/mm2) of wavelengths of 520 nm (for SpiRh1), 405 nm (for SpiRh1[S186F]), and 470 nm (for ChRWR) for 1 s (for SpiRh1 and SpiRh1[S186F]) or 100 ms (for ChRWR). Typical movies are shown in Figure 2—videos 1–3. Scale bar = 150 μm in (B), 10 μm in the insets of (B). |
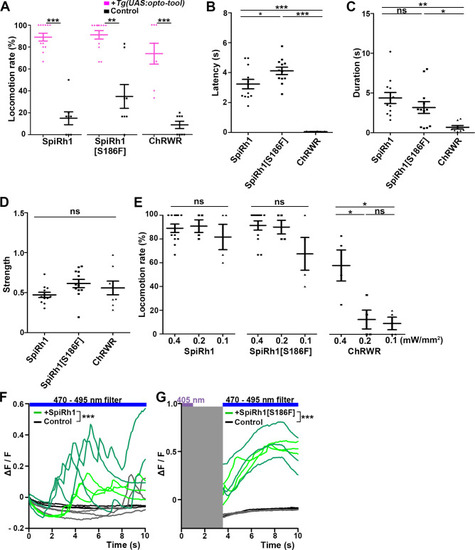
Locomotion induced by SpiRh1, SpiRh1[S186F], and ChRWR. (A) Light stimulus-dependent locomotion rates of 3-dpf Tg larvae expressing SpiRh1, SpiRh1[S186F] and ChRWR in hindbrain reticulospinal V2a neurons. Sibling larvae that did not express the tools were used as controls. The hindbrain area of the larvae was irradiated with light (0.4 mW/mm2) of wavelengths of 520 nm for 1 s (SpiRh1), 405 nm for 1 s (SpiRh1[S186F]), and 470 nm for 100 ms (ChRWR). Six consecutive stimulus trials were analyzed for 8 or 12 larvae of each Tg line (n=12 for SpiRh1 and SpiRh1[S186F], n=8 for ChRWR). For each larva, the average percentage of trials in which tail movement was elicited was calculated as the locomotion rates and plotted in graphs. Wilcoxon rank sum test (SpiRh1 vs control, p=0.000192; SpiRh1[S186F] vs control, p=0.00664; ChRWR vs control, p=0.000792). (B, C, D) Light stimulus-evoked tail movements of latency (B), duration (C), and strength (D). The time from the start of light application to the first tail movement was defined as latency (s), and the time from the beginning to the end of the first tail movement was defined as duration (s). The maximum distance the caudal fin moved from the midline divided by body length was measured as strength. One-way ANOVA with Tukey’s post hoc test (latency SpiRh1 vs SpiRh1[S186F], p=0.0424; SpiRh1 vs ChRWR, p=1.58e-08; SpiRh1[S186F] vs ChRWR, p=7.40 e-11; duration SpiRh1 vs ChRWR; p=0.00245; SpiRh1[S186F] vs ChRWR; p=0.0469). (E) Locomotion rates evoked by the stimulus light of various intensities. For each Tg line and each condition, six consecutive stimulus trials were analyzed for 4 or 12 larvae (n=12 for 0.4 mW/mm2 light stimulation with SpiRh1 and SpiRh1[S186F], n=4 for others) and the average locomotion rates were calculated. For comparison, Tg fish expressing ChRWR were also irradiated for 1 s. One-way ANOVA with Tukey’s post hoc test (ChRWR 0.4 mW/mm2 vs 0.2 mW/mm2, p=0.0181; 0.4 mW/mm2 vs 0.1 mW/mm2, p=0.0124; 0.2 mW/mm2 vs 0.1 mW/mm2, p=0.966). (F, G) Light-evoked Ca2+ increased with SpiRh1 (F) and SpiRh1[S186F] (G) in hindbrain V2a neurons. 3-dpf Tg(vsx2:GAL4FF);Tg(UAS-hsp70l:SpiRh1-Flag-P2A-TagCFP, myl7:mCherry);Tg(UAS-hsp70l:GCaMP6s) and Tg(vsx2:GAL4FF);Tg(UAS-hsp70l:SpiRh1[S186F]-Flag-P2A-TagCFP, myl7:mCherry);Tg(UAS-hsp70l:GCaMP6s) larvae were used. Sibling larvae that expressed GCaMP6s but did not express SpiRh1 or SpiRh1[S186F] were used as controls. The hindbrain area was irradiated and GCaMP6s fluorescence was detected with a fluorescence detection filter (excitation 470–495 nm, emission 510–550 nm) for SpiRh1. For SpiRh1[S186F], GCaMP6s fluorescence was detected after 1 s of 405 nm light application and filter conversion (about 4 s, shown in gray shade). Two larvae for each condition (SpiRh1, SpiRh1[S186F], and controls) were analyzed and three consecutive trials were analyzed. The change in fluorescence intensity of GCaMP6s (ΔF/F) is indicated as a ratio to the fluorescence intensity at the start of stimulation (F) for SpiRh1 and before (G) the start of stimulation with 405 nm light for SpiRh1[S186F]. The ΔF/F of Tg larvae expressing SpiRh1 or SpiRh1[S186F] is indicated by green lines whereas that of control larvae is indicated by black lines. Data from the three light applications are shown. Ca2+ responses were significantly higher in Tg larvae expressing SpiRh1 and SpiRh1[S186F] than control larvae. Linear mixed-effects model, * p<0.05, ** p<0.01, *** p<0.001, ns, not significant. Means and SEMs are shown. |
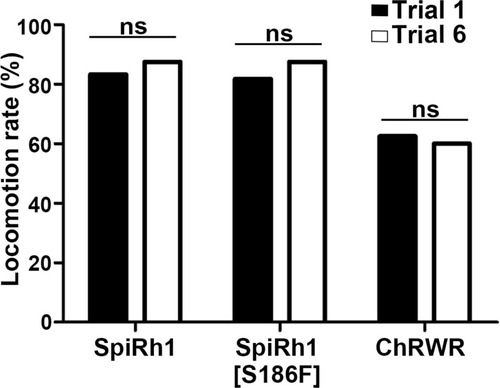
Effect of trial number on locomotion rate. Locomotion rates in trials 1 and 6 are shown (n=12 for SpiRh1 and SpiRh1[S186F], n=8 for ChRWR). Means and SEMs are indicated. ns, not significant; one-way ANOVA with Tukey’s post hoc test. |
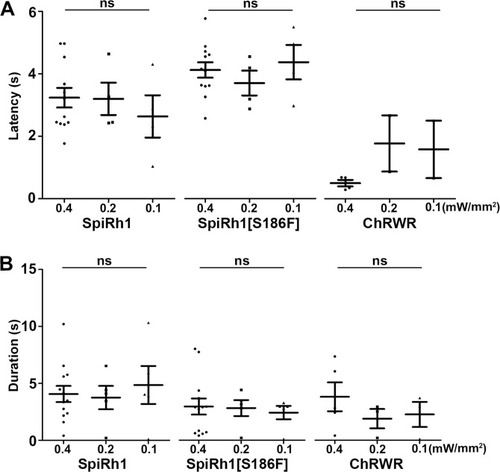
Latency and duration of locomotion induced with light of various intensities. Latency ( |
( |
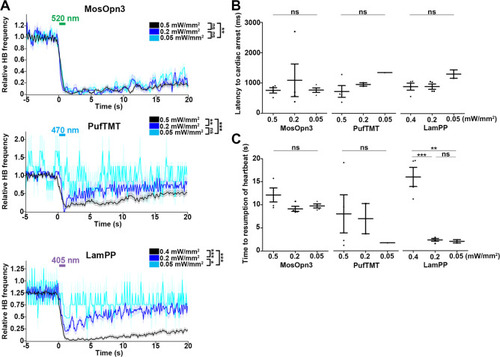
Change in heartbeats (HBs) after stimulation with light of various intensities. ( |
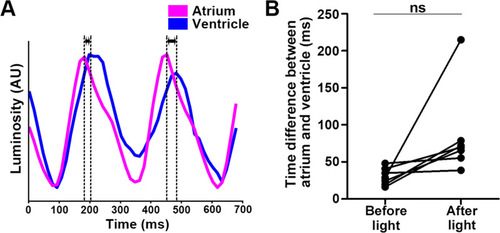
Time difference between atrial and ventricular contractions. ( |
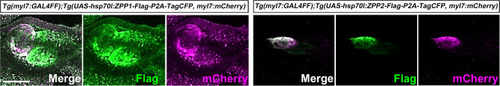
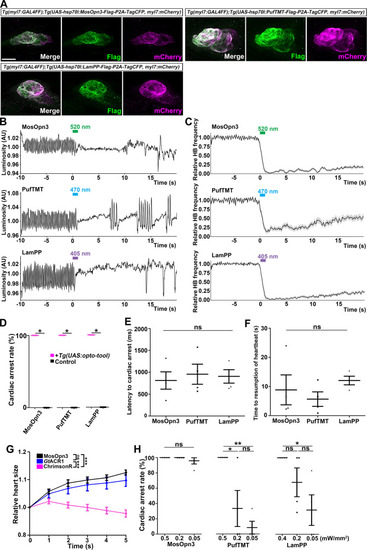
Expression of ZPP1 and ZPP2 in cardiomyocytes. Immunostaining of 4-dpf |
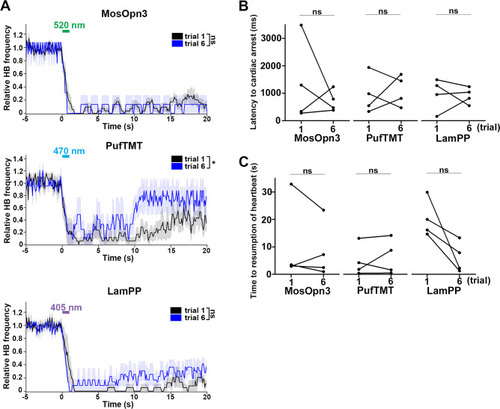
Effect of trial number on heartbeats (HBs). (A) Average relative HB frequency of larvae expressing MosOpn3 (n=7 for trial 1; n=2 for trial 6), PufTMT (n=5 for trial 1; n=3 for trial 6), and LamPP (n=4 for both trials 1 and 6) in cardiomyocytes. The heart area of Tg larvae was irradiated with light (520 nm for MosOpn3, 470 nm for PufTMT, and 405 nm for LamPP) at 0.5 mW/mm2 for 1 s at the indicated period. The statistical analysis employed the linear mixed effects model. Shading indicates SEM. (B, C) Latency to cardiac arrest (B) and time to resumption of HBs (C) in trials 1 and 6. Four larvae for each Tg line were analyzed. There were no significant differences in latency or time to resumption between trials 1 and 6 of MosOpn3, PufTMT, and LamPP. Student’s t-test, * p<0.05; ns, not significant. |
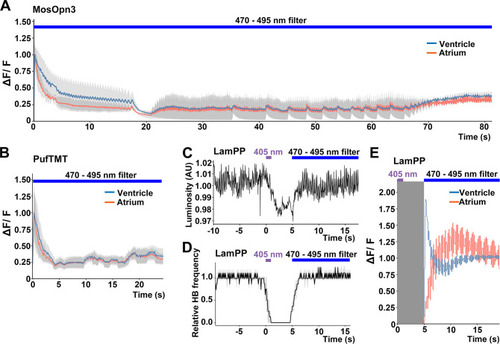
Switchable control of heartbeats by Gi/o-coupled bistable rhodopsins. (A, B) Average changes in fluorescence of GCaMP6s (ΔF/F) of 4-dpf larvae expressing MosOpn3 (A) or PufTMT (B), and GCaMP6s in cardiomyocytes. The heart area was irradiated with a fluorescence detection filter (excitation 470–495 nm, emission 510–550 nm) for the indicated period (n=2 for MosOpn3, n=4 for PufTMT). ΔF/F was calculated as a ratio to the fluorescence intensity of GCaMP6s at the start of stimulation. (C, D) HB monitoring by luminosity (AU) change (C) and average of relative HB frequency (n=2) (D) of 4-dpf larvae expressing LamPP in cardiomyocytes. The heart area was irradiated with 405 nm light (0.5 mW/mm2) for 1 s and then with a fluorescence detection filter (470–495 nm light) for the indicated period. Gray shading indicates SEMs (A, B, D). (E) Changes in ΔF/F of GCaMP6s of a larva expressing LamPP and GCaMP6s in the heart. The heart area was irradiated with 405 nm light (0.5 mW/mm2) for 1 s and then with a fluorescence detection filter (470–495 nm light) for the indicated period. GCaMP6s fluorescence was detected after light stimulation and filter conversion (5 s, shown in gray shading). ΔF/F was calculated as the ratio to the fluorescence intensity of GCaMP6s at the steady state (after the resumption of HBs). Blue and red lines indicate ΔF/F in the ventricle and atrium, respectively (A, B, E). |
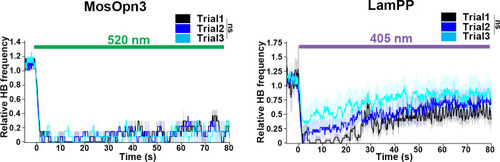
Average relative heartbeat frequency during prolonged irradiation. The heart area of Tg larvae expressing MosOpn3 or LamPP was irradiated for 80 s with 0.5 mW/mm2 light of 520 nm for MosOpn3 and 0.4 mW/mm2 light of 405 nm for LamPP. Three stimulation trials were performed with a 20 min interval in between. Two MosOpn3- and four LamPP-expressing larvae were analyzed. Linear mixed effects model; ns, not significant. |
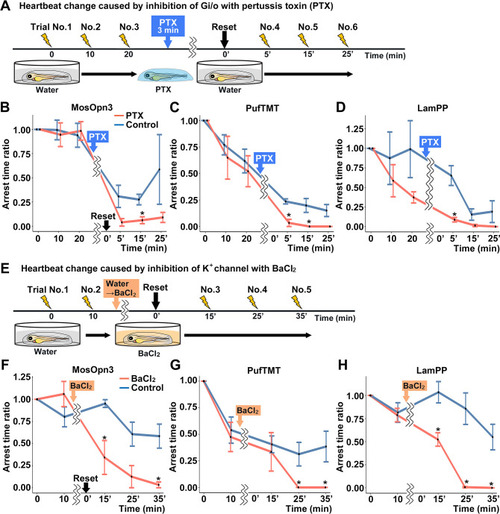
Gi/o and inward-rectifier K+ channel-dependent cardiac arrest by Gi/o-coupled bistable rhodopsins. (A) Time course of light application and treatment with pertussis toxin (PTX) (min, minutes). 4-dpf Tg larvae expressing MosOpn3, PufTMT, or LamPP in cardiomyocytes were used. After three trials of light stimulation of the heart area in larvae embedded in agarose, the larvae were treated with PTX for 3 min and embedded in agarose again and subjected to three subsequent light stimulation trials. In each trial, the heart area was irradiated with light (520 nm for MosOpn3, 470 nm for PufTMT, and 405 nm for LamPP) at an intensity of 0.5 mW/mm2 for 1 s, and cardiac arrest time was measured. The ratio to cardiac arrest time during the first trial was calculated (arrest time ratio). (B, C, D) Effect of PTX treatment on cardiac arrest induced by MosOpn3 (B), PufTMT (C), and LamPP (D). Average arrest time ratio of larvae expressing MosOpn3 (B), PufTMT (C), or LamPP (D) is shown in graphs. Larvae that were not treated with PTX were used as controls. Four treated and four non-treated control larvae were analyzed for each opto-tool. Wilcoxon rank sum test (MosOpn3 PTX vs control at 15 min, p=0.0294; PufTMT PTX vs control at 5 and 15 min, p=0.0265 and 0.0210; LamPP PTX vs control at 5 min, p=0.0285). (E) Time course of light application and treatment with BaCl2. After two trials of light stimulation of the heart area in larvae embedded in agarose, the larvae were treated with BaCl2 (or water) and subjected to three subsequent light stimulation trials. In each trial, the heart area was irradiated with light at an intensity of 0.5 mW/mm2 for 1 s. Cardiac arrest time was measured and the arrest time ratio was calculated. (F, G, H) Effect of BaCl2 treatment on cardiac arrest induced by MosOpn3 (F), PufTMT (G), and LamPP (H). Average arrest time ratio of larvae expressing MosOpn3 (F), PufTMT (G), or LamPP (H) is shown in graphs. Larvae that were not treated with BaCl2 were used as controls. Four treated and four non-treated control larvae were analyzed for each opto-tool. Wilcoxon rank sum test (MosOpn3 BaCl2 vs control at 15 and 35 min, p=0.0285 and 0.0265; PufTMT BaCl2 vs control at 25 and 35 min, p=0.0210 and 0.0210; LamPP BaCl2 vs control at 15, 25, and 35 min, p=0.0285, 0.0265, and 0.0210). * p<0.05. Means and SEMs are shown. |