
Figure 6
- ID
- ZDB-FIG-230818-21
- Publication
- Hagio et al., 2023 - Optogenetic manipulation of Gq- and Gi/o-coupled receptor signaling in neurons and heart muscle cells
- Other Figures
- All Figure Page
- Back to All Figure Page
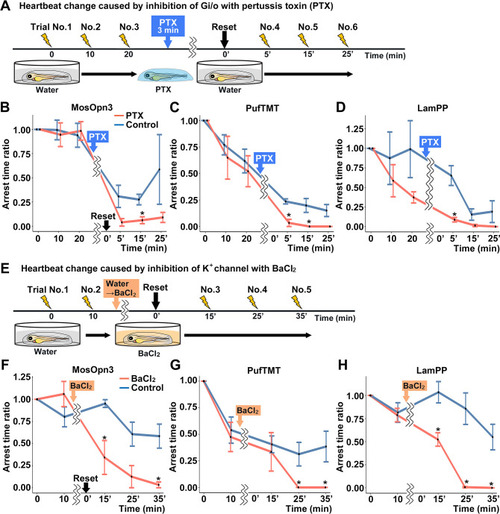
Gi/o and inward-rectifier K+ channel-dependent cardiac arrest by Gi/o-coupled bistable rhodopsins. (A) Time course of light application and treatment with pertussis toxin (PTX) (min, minutes). 4-dpf Tg larvae expressing MosOpn3, PufTMT, or LamPP in cardiomyocytes were used. After three trials of light stimulation of the heart area in larvae embedded in agarose, the larvae were treated with PTX for 3 min and embedded in agarose again and subjected to three subsequent light stimulation trials. In each trial, the heart area was irradiated with light (520 nm for MosOpn3, 470 nm for PufTMT, and 405 nm for LamPP) at an intensity of 0.5 mW/mm2 for 1 s, and cardiac arrest time was measured. The ratio to cardiac arrest time during the first trial was calculated (arrest time ratio). (B, C, D) Effect of PTX treatment on cardiac arrest induced by MosOpn3 (B), PufTMT (C), and LamPP (D). Average arrest time ratio of larvae expressing MosOpn3 (B), PufTMT (C), or LamPP (D) is shown in graphs. Larvae that were not treated with PTX were used as controls. Four treated and four non-treated control larvae were analyzed for each opto-tool. Wilcoxon rank sum test (MosOpn3 PTX vs control at 15 min, p=0.0294; PufTMT PTX vs control at 5 and 15 min, p=0.0265 and 0.0210; LamPP PTX vs control at 5 min, p=0.0285). (E) Time course of light application and treatment with BaCl2. After two trials of light stimulation of the heart area in larvae embedded in agarose, the larvae were treated with BaCl2 (or water) and subjected to three subsequent light stimulation trials. In each trial, the heart area was irradiated with light at an intensity of 0.5 mW/mm2 for 1 s. Cardiac arrest time was measured and the arrest time ratio was calculated. (F, G, H) Effect of BaCl2 treatment on cardiac arrest induced by MosOpn3 (F), PufTMT (G), and LamPP (H). Average arrest time ratio of larvae expressing MosOpn3 (F), PufTMT (G), or LamPP (H) is shown in graphs. Larvae that were not treated with BaCl2 were used as controls. Four treated and four non-treated control larvae were analyzed for each opto-tool. Wilcoxon rank sum test (MosOpn3 BaCl2 vs control at 15 and 35 min, p=0.0285 and 0.0265; PufTMT BaCl2 vs control at 25 and 35 min, p=0.0210 and 0.0210; LamPP BaCl2 vs control at 15, 25, and 35 min, p=0.0285, 0.0265, and 0.0210). * p<0.05. Means and SEMs are shown. |