
Figure 5
- ID
- ZDB-FIG-230818-26
- Publication
- Hagio et al., 2023 - Optogenetic manipulation of Gq- and Gi/o-coupled receptor signaling in neurons and heart muscle cells
- Other Figures
- All Figure Page
- Back to All Figure Page
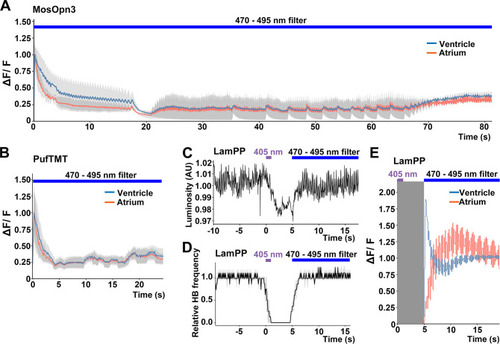
Switchable control of heartbeats by Gi/o-coupled bistable rhodopsins. (A, B) Average changes in fluorescence of GCaMP6s (ΔF/F) of 4-dpf larvae expressing MosOpn3 (A) or PufTMT (B), and GCaMP6s in cardiomyocytes. The heart area was irradiated with a fluorescence detection filter (excitation 470–495 nm, emission 510–550 nm) for the indicated period (n=2 for MosOpn3, n=4 for PufTMT). ΔF/F was calculated as a ratio to the fluorescence intensity of GCaMP6s at the start of stimulation. (C, D) HB monitoring by luminosity (AU) change (C) and average of relative HB frequency (n=2) (D) of 4-dpf larvae expressing LamPP in cardiomyocytes. The heart area was irradiated with 405 nm light (0.5 mW/mm2) for 1 s and then with a fluorescence detection filter (470–495 nm light) for the indicated period. Gray shading indicates SEMs (A, B, D). (E) Changes in ΔF/F of GCaMP6s of a larva expressing LamPP and GCaMP6s in the heart. The heart area was irradiated with 405 nm light (0.5 mW/mm2) for 1 s and then with a fluorescence detection filter (470–495 nm light) for the indicated period. GCaMP6s fluorescence was detected after light stimulation and filter conversion (5 s, shown in gray shading). ΔF/F was calculated as the ratio to the fluorescence intensity of GCaMP6s at the steady state (after the resumption of HBs). Blue and red lines indicate ΔF/F in the ventricle and atrium, respectively (A, B, E). |