Figure 4—figure supplement 3

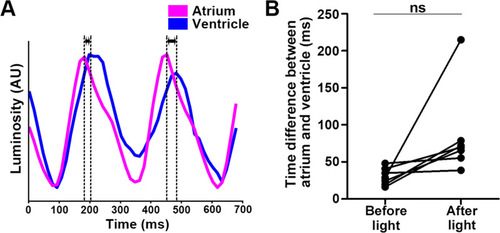
Time difference between atrial and ventricular contractions.

(A) Heartbeats (HBs) of atrium and ventricle. The heart area of 4-dpf Tg larvae expressing MosOpn3 was irradiated with 520 nm light at an intensity of 0.5 mW/mm2 for 1 s. HB data were extracted from luminosity data of arbitrary positions of the atrium and ventricle. The time difference between atrial and ventricular (AV) contractions is indicated. (B) Time difference between AV contractions before and after light application. The 10 s period before light application is defined as ‘before light application’. The state in which the interval between HBs was twice as long as the interval before light application, but less than 5 s, is defined as ‘after light application’. Time differences between AV contractions before and after light applications were calculated and plotted in a graph. Seven trials were analyzed from six larvae. Student’s t-test; ns, not significant (p=0.0758).

Expression Data

Expression Detail
Antibody Labeling
Phenotype Data

Phenotype Detail
Acknowledgments
This image is the copyrighted work of the attributed author or publisher, and ZFIN has permission only to display this image to its users. Additional permissions should be obtained from the applicable author or publisher of the image. Full text @ Elife