
|
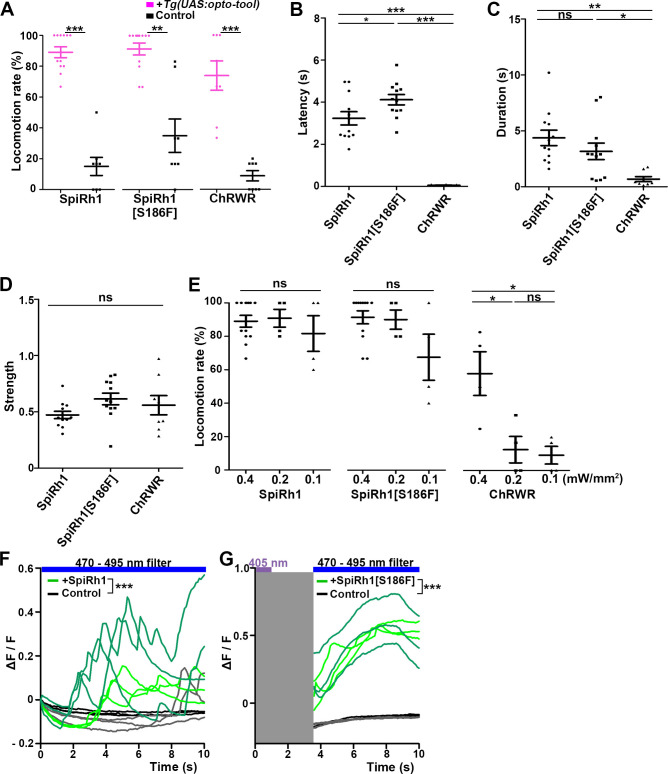
Figure 3 Locomotion induced by SpiRh1, SpiRh1[S186F], and ChRWR. (A) Light stimulus-dependent locomotion rates of 3-dpf Tg larvae expressing SpiRh1, SpiRh1[S186F] and ChRWR in hindbrain reticulospinal V2a neurons. Sibling larvae that did not express the tools were used as controls. The hindbrain area of the larvae was irradiated with light (0.4 mW/mm2) of wavelengths of 520 nm for 1 s (SpiRh1), 405 nm for 1 s (SpiRh1[S186F]), and 470 nm for 100 ms (ChRWR). Six consecutive stimulus trials were analyzed for 8 or 12 larvae of each Tg line (n=12 for SpiRh1 and SpiRh1[S186F], n=8 for ChRWR). For each larva, the average percentage of trials in which tail movement was elicited was calculated as the locomotion rates and plotted in graphs. Wilcoxon rank sum test (SpiRh1 vs control, p=0.000192; SpiRh1[S186F] vs control, p=0.00664; ChRWR vs control, p=0.000792). (B, C, D) Light stimulus-evoked tail movements of latency (B), duration (C), and strength (D). The time from the start of light application to the first tail movement was defined as latency (s), and the time from the beginning to the end of the first tail movement was defined as duration (s). The maximum distance the caudal fin moved from the midline divided by body length was measured as strength. One-way ANOVA with Tukey’s post hoc test (latency SpiRh1 vs SpiRh1[S186F], p=0.0424; SpiRh1 vs ChRWR, p=1.58e-08; SpiRh1[S186F] vs ChRWR, p=7.40 e-11; duration SpiRh1 vs ChRWR; p=0.00245; SpiRh1[S186F] vs ChRWR; p=0.0469). (E) Locomotion rates evoked by the stimulus light of various intensities. For each Tg line and each condition, six consecutive stimulus trials were analyzed for 4 or 12 larvae (n=12 for 0.4 mW/mm2 light stimulation with SpiRh1 and SpiRh1[S186F], n=4 for others) and the average locomotion rates were calculated. For comparison, Tg fish expressing ChRWR were also irradiated for 1 s. One-way ANOVA with Tukey’s post hoc test (ChRWR 0.4 mW/mm2 vs 0.2 mW/mm2, p=0.0181; 0.4 mW/mm2 vs 0.1 mW/mm2, p=0.0124; 0.2 mW/mm2 vs 0.1 mW/mm2, p=0.966). (F, G) Light-evoked Ca2+ increased with SpiRh1 (F) and SpiRh1[S186F] (G) in hindbrain V2a neurons. 3-dpf Tg(vsx2:GAL4FF);Tg(UAS-hsp70l:SpiRh1-Flag-P2A-TagCFP, myl7:mCherry);Tg(UAS-hsp70l:GCaMP6s) and Tg(vsx2:GAL4FF);Tg(UAS-hsp70l:SpiRh1[S186F]-Flag-P2A-TagCFP, myl7:mCherry);Tg(UAS-hsp70l:GCaMP6s) larvae were used. Sibling larvae that expressed GCaMP6s but did not express SpiRh1 or SpiRh1[S186F] were used as controls. The hindbrain area was irradiated and GCaMP6s fluorescence was detected with a fluorescence detection filter (excitation 470–495 nm, emission 510–550 nm) for SpiRh1. For SpiRh1[S186F], GCaMP6s fluorescence was detected after 1 s of 405 nm light application and filter conversion (about 4 s, shown in gray shade). Two larvae for each condition (SpiRh1, SpiRh1[S186F], and controls) were analyzed and three consecutive trials were analyzed. The change in fluorescence intensity of GCaMP6s (ΔF/F) is indicated as a ratio to the fluorescence intensity at the start of stimulation (F) for SpiRh1 and before (G) the start of stimulation with 405 nm light for SpiRh1[S186F]. The ΔF/F of Tg larvae expressing SpiRh1 or SpiRh1[S186F] is indicated by green lines whereas that of control larvae is indicated by black lines. Data from the three light applications are shown. Ca2+ responses were significantly higher in Tg larvae expressing SpiRh1 and SpiRh1[S186F] than control larvae. Linear mixed-effects model, * p<0.05, ** p<0.01, *** p<0.001, ns, not significant. Means and SEMs are shown.