IMAGE

Figure 1

ID
ZDB-IMAGE-230818-16
Source
Figures for Hagio et al., 2023
Image
Figure Caption

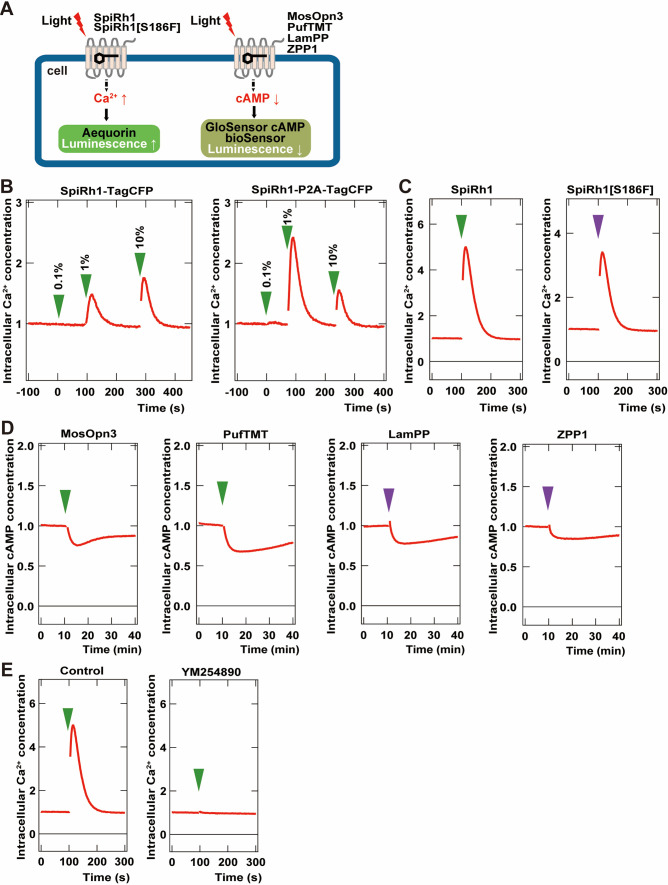
Figure 1 Activity of G-coupled bistable rhodopsins in HEK293S cells.

(A) Schematic of intracellular Ca2+ or cAMP measurements in HEK293S cells. Intracellular Ca2+ and cAMP concentrations in rhodopsin-expressing HEK293S cells were measured using the aequorin m2 assay or the GloSensor 20 F assay, respectively. (B) Comparison of optogenetic activities of Gq-coupled Spider Rh1 (SpiRh1) expressed using TagCFP fusion protein and the P2A-TagCFP system. HEK293S cells were transfected with an expression plasmid for the fusion protein of SpiRh1 and TagCFP (SpiRh1-TagCFP, left panel), or for that of Flag-tagged SpiRh1, porcine teschovirus 2 A peptide, and TagCFP (SpiRh1-P2A-TagCFP, right panel). Transfected cells were incubated with 11-cis retinal and stimulated by different intensities of 500 nm light (0.1%, 1%, or 10% of the light intensity, with 0.106 mW/mm2 as 100%). Intracellular Ca2+ concentration was measured by using aequorin m2 and is indicated as a ratio to the unstimulated state in the graphs. (C) Comparison of activities of Flag-tagged SpiRh1 and SpiRh1 [S186F]. Transfected cells were stimulated by 500 nm (green arrow, 0.106 mW/mm2) or 410 nm (purple arrow, 0.0194 mW/mm2) light and intracellular Ca2+ concentration was measured. (D) Light-stimulus-dependent reduction of intracellular cAMP level by Gi/o-coupled mosquito Opn3 (MosOpn3), pufferfish TMT (PufTMT), lamprey PP (LamPP), and zebrafish PP1 (ZPP1). HEK293S cells were transfected with expression plasmids for flagged-tagged Gi/o rhodopsins. Transfected cells were incubated with 11-cis retinal and stimulated by 500 nm (green arrow) or 410 nm (purple arrow) light. Intracellular cAMP concentration was measured with GloSensor 20 F and is indicated as a ratio to the unstimulated state. (E) Effects of Gαq inhibitor YM254890 on SpiRh1. HEK293S cells transfected with an expression plasmid for SpiRh1 were incubated with 11-cis retinal alone (left panel) or with 11-cis retinal and YM254890 (right panel), and stimulated by 500 nm light. Intracellular Ca2+ concentration was measured.

Acknowledgments
This image is the copyrighted work of the attributed author or publisher, and ZFIN has permission only to display this image to its users. Additional permissions should be obtained from the applicable author or publisher of the image. Full text @ Elife