Image
Figure Caption

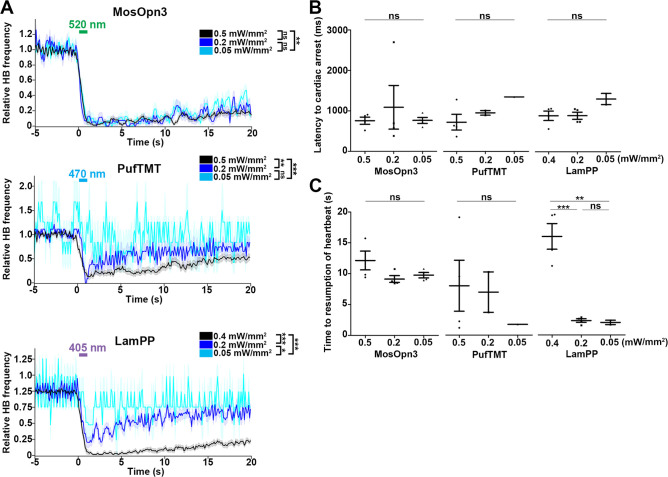
Figure 4—figure supplement 2 Change in heartbeats (HBs) after stimulation with light of various intensities.

(A) Average relative HB frequency of larvae expressing MosOpn3, PufTMT, and LamPP in cardiomyocytes. The heart area of Tg larvae was irradiated with light (520 nm for MosOpn3, 470 nm for PufTMT, and 405 nm for LamPP) at 0.5, 0.2 or 0.05 mW/mm2 (for MosOpn3 and PufTMT), or 0.4, 0.2 or 0.05 mW/mm2 (for LamPP) for 1s at the indicated period. MosOpn3 (n=24 for 0.5 mW/mm2, n=18 for 0.2 mW/mm2, n=16 for 0.05 mW/mm2), PufTMT (n=24 for 0.5 mW/mm2, n=6 for 0.2 mW/mm2, n=4 for 0.05 mW/mm2), and LamPP (n=24 for 0.5 mW/mm2, n=18 for 0.2 mW/mm2, n=2 for 0.05 mW/mm2)-expressing larvae were analyzed. The statistical analysis employed the linear mixed effects model. Shading indicates SEM. (B) Latency to cardiac arrest (B) and time to resumption of HBs (C). Six consecutive trials were analyzed in four larvae for each condition. MosOpn3 (n=4 for 0.5, 0.2 and 0.05 mW/mm2), PufTMT (n=4 for 0.5 mW/mm2, n=2 for 0.2 mW/mm2, n=1 for 0.05 mW/mm2), and LamPP (n=4 for 0.4 mW/mm2, n=4 for 0.2 mW/mm2, n=2 for 0.05 mW/mm2)-expressing larvae were analyzed. One-way ANOVA with Tukey’s post hoc test (time to resumption of HBs LamPP 0.4 mW/mm2 vs 0.2 mW/mm2, p=0.000531; 0.2 mW/mm2 vs 0.05 mW/mm2, p=0.991; 0.4 mW/mm2 vs 0.05 mW/mm2, p=0.00158), * p<0.05. ** p<0.01. *** p<0.001; ns, not significant. Means and SEMs are indicated.

Acknowledgments
This image is the copyrighted work of the attributed author or publisher, and ZFIN has permission only to display this image to its users. Additional permissions should be obtained from the applicable author or publisher of the image. Full text @ Elife