
- Title
-
The Roles of Histamine Receptor 1 (hrh1) in Neurotransmitter System Regulation, Behavior, and Neurogenesis in Zebrafish
- Authors
- Yao, Y., Baronio, D., Chen, Y.C., Jin, C., Panula, P.
- Source
- Full text @ Mol. Neurobiol.
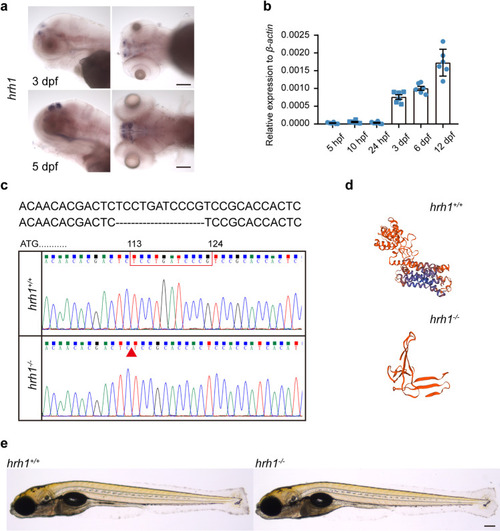
EXPRESSION / LABELING:
PHENOTYPE:
|
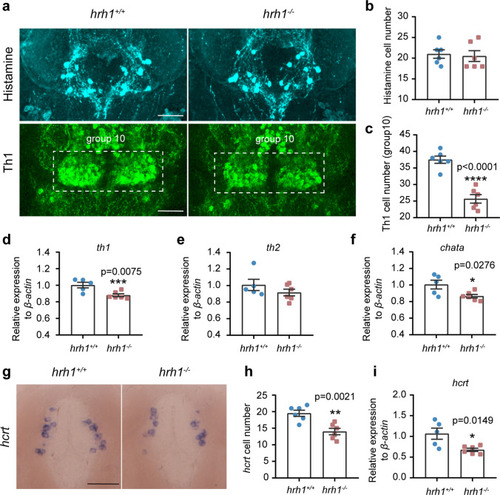
Histaminergic, dopaminergic, and hcrt systems in |
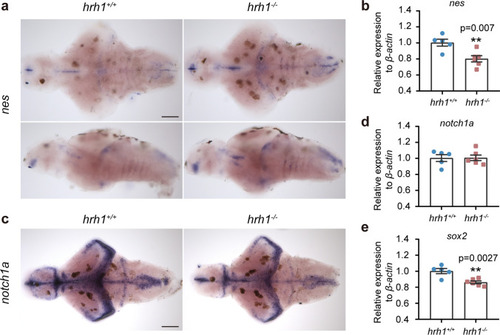
Neurogenesis markers in |
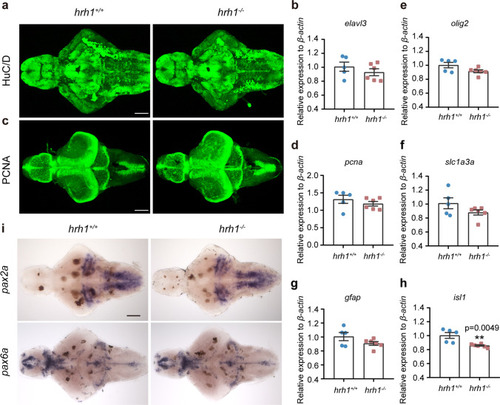
Proliferation and differentiation markers in |

Larval behavior of PHENOTYPE:
|
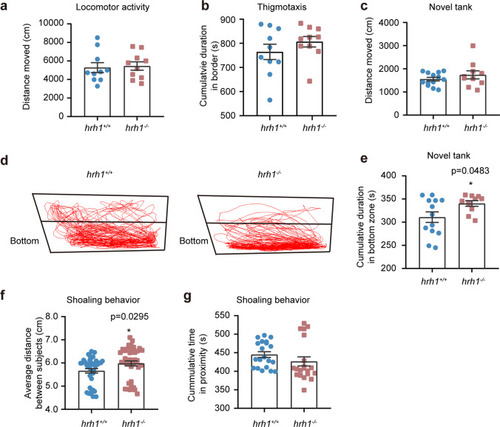
Adult behavior of PHENOTYPE:
|

ZFIN is incorporating published figure images and captions as part of an ongoing project. Figures from some publications have not yet been curated, or are not available for display because of copyright restrictions. EXPRESSION / LABELING:
|
|
Unillustrated author statements PHENOTYPE:
|