IMAGE

Fig. 2

ID
ZDB-IMAGE-231002-40
Source
Figures for Yao et al., 2023
Image
Figure Caption

Fig. 2

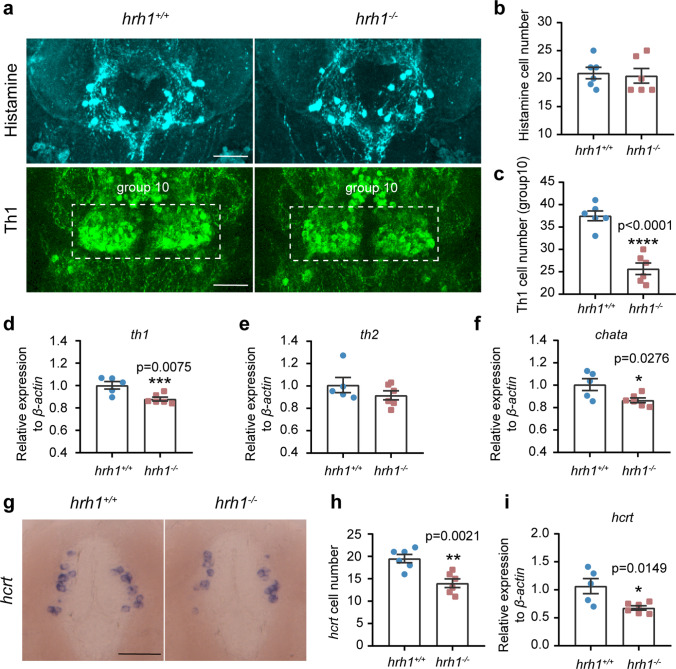
Histaminergic, dopaminergic, and hcrt systems in hrh1/ zebrafish. a Representative pictures (ventral view) for immunohistochemistry of histamine and Th1 in hrh1+/+ and hrh1/ 6 dpf zebrafish brains. Anterior to the left. Scale bars: 100 µm. b Histaminergic neuron numbers. N = 6. c Number of Th1-expressing neurons in group 10. N = 6. df qPCR results of th1, th2, chata in hrh1+/+ and hrh1/ in 6 dpf whole zebrafish. N (hrh1+/+) = 5, N (hrh1/) = 6. gh Representative pictures (ventral view) for in situ hybridization of hcrt in hrh1+/+ and hrh1/ 6 dpf zebrafish brain and cell numbers. Anterior to the top. Scale bar 50 µm. N = 6. i qPCR results of hcrt in hrh1+/+ and hrh1/ in 6 dpf whole zebrafish. N (hrh1+/+) = 5, N (hrh1/.) = 6. All histograms are mean ± SEM, unpaired t-test, two-tailed. *0.01 < P ≤ 0.05; **0.001 < P ≤ 0.01; ***0.0001 < P ≤ 0.001; ****P ≤ 0.0001

Acknowledgments
This image is the copyrighted work of the attributed author or publisher, and ZFIN has permission only to display this image to its users. Additional permissions should be obtained from the applicable author or publisher of the image. Full text @ Mol. Neurobiol.