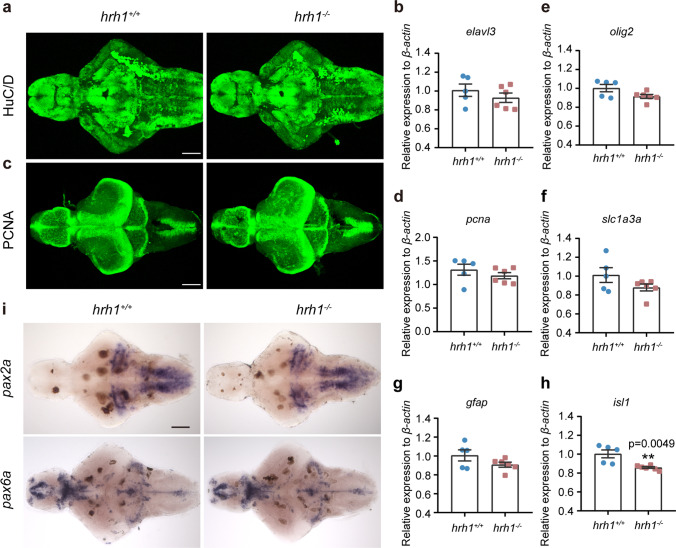
IMAGE

Fig. 4

ID
ZDB-IMAGE-231002-42
Source
Figures for Yao et al., 2023
Image
Figure Caption

Fig. 4

Proliferation and differentiation markers in hrh1−/− zebrafish. a Representative pictures (ventral view) for immunohistochemistry of HuC/D in hrh1+/+ and hrh1/ larval brain at 6 dpf. Anterior to the left. Scale bar: 100 µm. N = 6. c Representative pictures (dorsal view) for immunohistochemistry of PCNA in hrh1+/+ and hrh1/ larval brain at 6 dpf. Anterior to the left. Scale bar: 100 µm. N = 6. i Representative pictures (ventral view) for in situ hybridization of pax2a and pax6a in hrh1+/+ and hrh1/ larval brain at 6 dpf. Anterior to the left. Scale bar: 100 µm. b, dh qPCR results of elavl3, pcna, olig2, slc1a3a, gfap, and isl1 in whole larval zebrafish at 6 dpf. N (hrh1+/+) = 5, N (hrh1/.) = 6. All histograms are exhibit as mean ± SEM, unpaired t test, two tailed. **0.001 < P ≤ 0.01

Acknowledgments
This image is the copyrighted work of the attributed author or publisher, and ZFIN has permission only to display this image to its users. Additional permissions should be obtained from the applicable author or publisher of the image. Full text @ Mol. Neurobiol.