
- Title
-
Developmental exposure to domoic acid targets reticulospinal neurons and leads to aberrant myelination in the spinal cord
- Authors
- Panlilio, J.M., Hammar, K.M., Aluru, N., Hahn, M.E.
- Source
- Full text @ Sci. Rep.
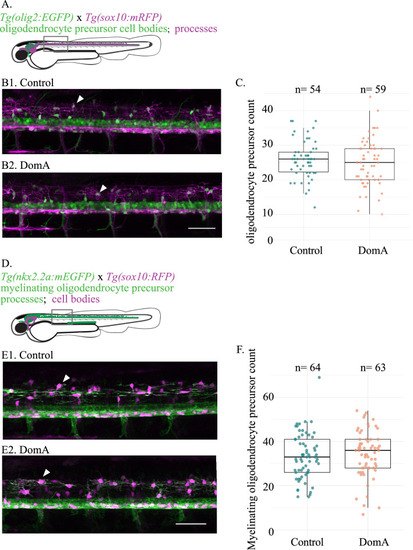
Exposure to DomA at 2 dpf did not reduce the number of oligodendrocyte precursors prior to myelination (A) Diagram of laterally mounted Tg(olig2:EGFP) × Tg(sox10:mRFP) double transgenic larvae with descriptions on the cell types and processes labelled by each transgene. The rectangle delineates the approximate location within the spinal cord where the image was acquired. (B) Representative images of the double transgenic fish, Tg(olig2:EGFP) × Tg(sox10:mRFP), imaged at 2.5 dpf. Control (B1) and DomA-exposed fish (B2). White arrow points to a dorsal oligodendrocyte precursors. (C) Oligodendrocyte precursor count in dorsal spinal cords of the control and DomA-exposed double transgenic fish—Tg(olig2:EGFP) × Tg(sox10:mRFP). Each point represents the number of oligodendrocyte precursors counted within the 403.1 μM imaging area in a single fish (Control—median = 26 and IQR = 6; DomA—median = 25, IQR = 9). Scale bar = 50 μm. (D) Diagram of laterally mounted Tg(nkx2.2a:mEGFP) x Tg(sox10:RFP) double transgenic larvae with descriptions on the cell types and processes labelled by each transgene. The rectangle delineates the approximate location within the spinal cord where the image was acquired. (E) Representative images of the double transgenic fish, Tg(nkx2.2a:mEGFP) × Tg(sox10:RFP), imaged at 2.5 dpf. Control (E1) and DomA exposed fish (E2). White arrow points to a dorsal oligodendrocyte precursors in the myelinating lineage. Scale bar = 50 μm (F) Counts of oligodendrocyte precursors that are fated to myelinate in the dorsal spinal cord in double transgenic fish—Tg(nkx2.2a:mEGFP) × Tg(sox10: RFP). Each point represents the number of oligodendrocyte precursors counted within the 354.3 μM imaging area in a single fish. (Control – median = 33, IQR = 15, DomA – median = 36, IQR = 13). Data shown are from two combined trials. See Supplemental Fig. 1 for data from individual trials. |
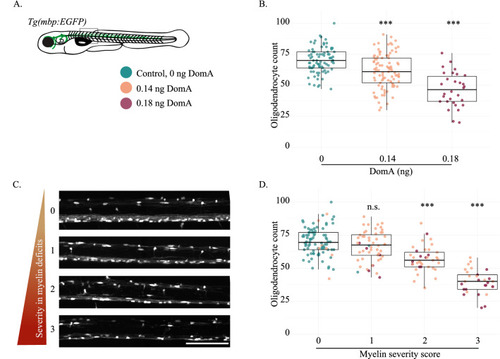
Exposure to DomA at 2 dpf reduces the number of myelinating oligodendrocytes in fish with severe myelin defects in a dose dependent manner. (A) The Tg(mbp:EGFP) transgenic line was used to quantify myelinating oligodendrocytes at 4 dpf. The rectangle delineates the approximate location within the spinal cord where the image was acquired (somites 6–10). (B) Number of myelinating oligodendrocytes quantified at 4 dpf in the spinal cords of fish exposed to different doses of DomA at 2 dpf. Each point represents the number of myelinating oligodendrocytes within the 403.9 μM imaging area in a single fish. (Control 0 ng – median = 70 and IQR = 13; DomA 0.14 ng – median = 62, IQR = 20; DomA 0.18 ng – median = 47, IQR = 20). (C) Representative images of laterally mounted Tg(mbp:EGFP) fish classified by myelin severity, ranging from 0, representing control-like myelin sheaths, to 3, representing the most severe myelin phenotype observed. (D) Fish used in (B) were further subdivided by the severity of the myelin defect observed. The myelinating oligodendrocyte counts were then plotted by the myelin severity score. Scale bar = 100 μm, n.s. = not significant, *** p < 1 e−3 using a generalized mixed effects model with a negative binomial distribution. |
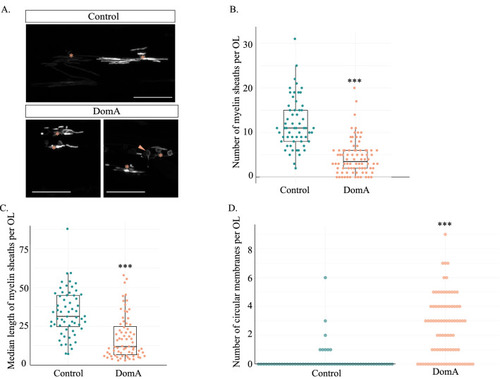
DomA reduces the length and number of myelin sheaths produced by individual oligodendrocytes by 4 dpf. (A) Representative images of mosaically labeled oligodendrocytes in DomA-exposed (2 dpf injected) and control fish following 1–4 cell injections of the reporter construct, mbp:EGFP-CAAX into Tg(sox10:RFP) background. Only EGFP channel is presented to show the sparsely labeled myelin sheaths. Asterisks mark oligodendrocyte cell bodies. Peach arrow points to aberrant circular profiles. Scale bar = 50 μm. (B) Number of myelin sheaths produced by single oligodendrocytes (OL) in both control and DomA exposed fish. (C) Median length of the myelin sheaths produced by individual OLs in μm. OL without myelin sheaths were excluded from this graph. (D) Number of circular myelin membranes produced by individual OLs. ***p < 1 e−3. |
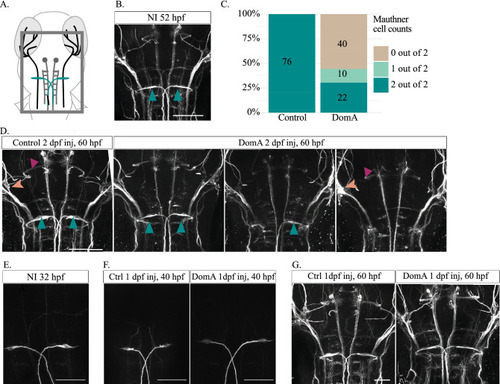
Exposure to DomA at 2 dpf (but not 1 dpf) leads to the loss of the Mauthner neuron prior to myelination. (A) Diagram of 2.5 dpf embryos that were dorsally mounted and immunostained with anti-3A10. The rectangle delineates the approximate area that was imaged. Mauthner cells are labeled in teal. (B) 3A10 immunostaining of approximately 52-hpf, non-injected (NI) embryos confirmed that all the major reticulospinal neurons are present by the 2 dpf (48–53 hpf) injection period (n = 26). Teal arrows label Mauthner cells. Scale bar = 100 μm. (C) Percentage of embryos exposed to DomA (2 dpf) or vehicle that had 0, 1, or 2 Mauthner cells after being stained for anti-3A10 at approximately 60 hpf. Numbers of larvae with each phenotype are listed within each bar. Data were aggregated from four trials. See Supplemental Fig. 3 for individual trial data. (D) 3A10 immunostaining of embryos that were exposed to DomA at 2 dpf then processed approximately 8 h post exposure (60 hpf). Teal arrows label Mauthner cells, peach arrows label the anterior lateral line, and magenta arrows label the medial longitudinal fasciculus. Scale bar = 100 μm. (E) 3A10 immunostaining of 32-hpf, non-injected (NI) embryos confirmed that all the major reticulospinal neurons are present by 1 dpf injection period (n = 10). Scale bar = 50 μm. (F) 3A10 immunostaining of embryos that were exposed to DomA at 1 dpf (32 hpf), then processed approximately 8 h post exposure (40 hpf). Control embryos (n = 38); DomA exposed embryos (n = 38), with n = 37 fish with 2 Mauthner cells, and n = 1 with 1 Mauthner cell. Scale bar = 50 μm. (G) 3A10 immunostaining of embryos that were exposed to DomA at 1 dpf (32 hpf), then processed at 60 hpf. Control embryos (n = 35), DomA exposed embryos (n = 41). All control and DomA-exposed fish had 2 Mauthner cells. Scale bar = 50 μm. |
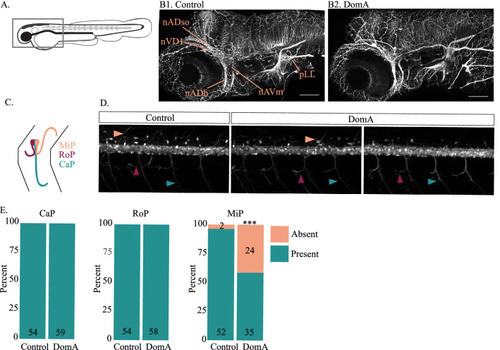
Exposure to DomA at 2 dpf does not grossly alter selected sensory neuron structures or the main axons of two of the three primary motor neurons. (A) Diagram of 2.5 dpf embryos laterally mounted and immunostained with anti-acetylated tubulin. The rectangle delineates the approximate area that was imaged. (B) Representative images of control (n = 35) and DomA-exposed larvae (n = 29) immunostained with anti-acetylated tubulin. Labels point to both the sensory ganglia that comprise the anterior lateral line (nADso, nVDI, nADb, nAVm) and to the peripheral lateral line (pLL). (C) Diagram of the axonal trajectories in the three types of primary motor neurons assessed in Tg(olig2:EGFP) fish. (D) Representative images of Tg(olig2:EGFP) × Tg(sox10:mRFP) fish exposed to vehicle or to DomA at 2 dpf then imaged at 2.5 dpf. Peach arrows point to the MiP main axons, magenta arrows point to the RoP main axons, and teal arrows point to the CaP main axons. Scale bar = 50 μm. These fish were the same fish used in Fig. 1, with only the EGFP shown. (E) Presence or absence of intact main axons of the three types of primary motor neurons in control and DomA-exposed fish. ***p < 0.001. Abbreviations: nADso superior opthalmic ramus of the anterodorsal lateral line nerve, nVDI dorsolateral nerve of the trigeminal ganglion, nADb buccal ramus of the anterodorsal lateral line nerve or nAVm the mandibular ramus of the anterior lateral line nerve. MiP Middle primary motor neuron, RoP rostral primary motor neuron, CaP Caudal primary motor neurons. |
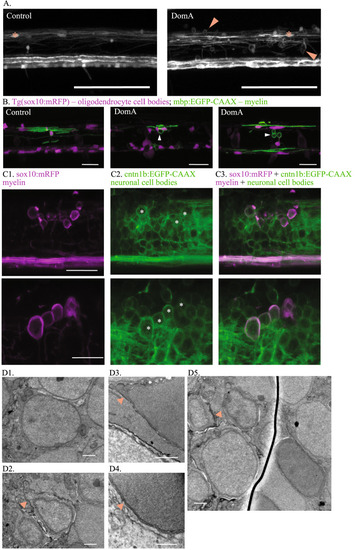
DomA exposure at 2 dpf leads to the formation of aberrant circular profiles that may be ectopically myelinated neuronal cell bodies. (A) Tg(mbp:EGFP) × Tg(mbp:EGFP-CAAX) double transgenic line labels both oligodendrocyte cell bodies and myelin sheaths. Asterisks mark oligodendrocyte cell bodies. Arrows label circular myelin membranes, which are commonly found in DomA-exposed larvae and rarely observed in controls. Scale bar = 100 μm. (B) Representative images of mosaically labeled oligodendrocytes in DomA-exposed (2 dpf) and control fish following 1–4 cell injections of the reporter construct, mbp:EGFP-CAAX into Tg(sox10:RFP) background, imaged at 4 dpf. Oligodendrocyte cell bodies are labeled in red. Arrows mark circular myelin membranes, which are outlined in green. These were the same fish used in Fig. 3, but with the red channel present to show the oligodendrocyte cell body. Scale bar = 25 μm. (C) Tg(sox10:mRFP) × Tg(cntn1b:EGFP-CAAX) double transgenic line imaged at 5 dpf. mRFP labels myelin sheaths and oligodendrocyte membranes. EGFP-CAAX labels the membrane of subpopulations of spinal cord neurons. Two examples of DomA-exposed double transgenic fish. Circular myelin membranes labeled in RFP (false colored magenta) (C1), neuronal cell bodies outlined in EGFP (C2). Images were then merged (C3). Asterisks mark neuronal cell bodies that are potentially associated with circular myelin membranes in the imaging plane. Top image scale bar = 25 μm., bottom image scale bar = 20 μm (D) Scanning electron micrograph of neuronal cell bodies in the spinal cords of Tg(mbp:EGFP-CAAX) fish. (D1) Example neuronal cell body in a control fish shows no evidence of myelin surrounding it. (D2–D5) Example neuronal cell bodies in DomA-exposed fish that may be wrapped by myelin. Arrows point to the putative myelin that surrounds the cell body. (n = 1 control, n = 1 DomA-exposed) Scale bar = 1 μm. |
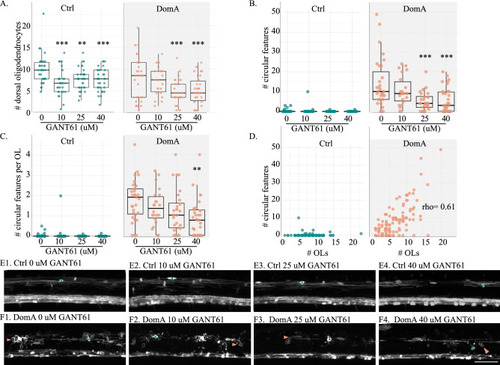
Treatment with GANT61, a small molecule that reduces the number of myelinating oligodendrocytes, also reduces the number of circular profiles in DomA treated fish. (A) Tg(mbp:EGFP) × Tg(mbp:EGFP-CAAX) double transgenic fish were exposed to DomA (0.14 ng) or vehicle at 2 dpf. Myelinating oligodendrocytes in the dorsal spinal cord were counted for control and DomA-exposed fish that were exposed to different concentrations of GANT61 (1.5- 4 dpf). Each point represents the number of oligodendrocytes counted within a 269 μM imaging area in a single fish. (B) Number of circular features in dorsal spinal cord of the same control and DomA exposed fish plotted in (A). (C) The number of circular features per oligodendrocyte (OL) in the dorsal spinal cord of the control and DomA-exposed fish that were exposed to different concentrations of GANT61. (D) The number of circular features plotted against the number of dorsal OLs. (E) Images of control fish exposed to 0 μM (E1), 10 μM (E2), 25 μM (E3), and 40 μM GANT61 (E4). (F) Images of DomA fish exposed to 0 μM (F1), 10 μM (F2), 25 μM (F3), and 40 μM GANT61 (F4). Scale bar = 50 μm.* = p < 0.05, ** = p < 0.01, *** p < 0.001 by generalized mixed models with a Poisson or a negative binomial distribution. Teal asterisks label oligodendrocyte cell bodies. Peach arrows point to circular features. Data were aggregated from two trials. See Supplemental Fig. 4 for data from individual trials. |