
Figure 4
- ID
- ZDB-FIG-230217-28
- Publication
- Panlilio et al., 2023 - Developmental exposure to domoic acid targets reticulospinal neurons and leads to aberrant myelination in the spinal cord
- Other Figures
- All Figure Page
- Back to All Figure Page
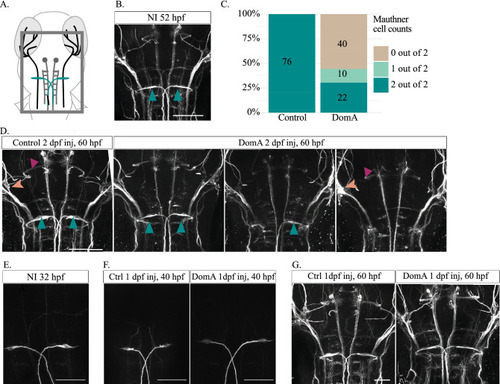
Exposure to DomA at 2 dpf (but not 1 dpf) leads to the loss of the Mauthner neuron prior to myelination. (A) Diagram of 2.5 dpf embryos that were dorsally mounted and immunostained with anti-3A10. The rectangle delineates the approximate area that was imaged. Mauthner cells are labeled in teal. (B) 3A10 immunostaining of approximately 52-hpf, non-injected (NI) embryos confirmed that all the major reticulospinal neurons are present by the 2 dpf (48–53 hpf) injection period (n = 26). Teal arrows label Mauthner cells. Scale bar = 100 μm. (C) Percentage of embryos exposed to DomA (2 dpf) or vehicle that had 0, 1, or 2 Mauthner cells after being stained for anti-3A10 at approximately 60 hpf. Numbers of larvae with each phenotype are listed within each bar. Data were aggregated from four trials. See Supplemental Fig. 3 for individual trial data. (D) 3A10 immunostaining of embryos that were exposed to DomA at 2 dpf then processed approximately 8 h post exposure (60 hpf). Teal arrows label Mauthner cells, peach arrows label the anterior lateral line, and magenta arrows label the medial longitudinal fasciculus. Scale bar = 100 μm. (E) 3A10 immunostaining of 32-hpf, non-injected (NI) embryos confirmed that all the major reticulospinal neurons are present by 1 dpf injection period (n = 10). Scale bar = 50 μm. (F) 3A10 immunostaining of embryos that were exposed to DomA at 1 dpf (32 hpf), then processed approximately 8 h post exposure (40 hpf). Control embryos (n = 38); DomA exposed embryos (n = 38), with n = 37 fish with 2 Mauthner cells, and n = 1 with 1 Mauthner cell. Scale bar = 50 μm. (G) 3A10 immunostaining of embryos that were exposed to DomA at 1 dpf (32 hpf), then processed at 60 hpf. Control embryos (n = 35), DomA exposed embryos (n = 41). All control and DomA-exposed fish had 2 Mauthner cells. Scale bar = 50 μm. |