
Figure 1
- ID
- ZDB-FIG-230217-25
- Publication
- Panlilio et al., 2023 - Developmental exposure to domoic acid targets reticulospinal neurons and leads to aberrant myelination in the spinal cord
- Other Figures
- All Figure Page
- Back to All Figure Page
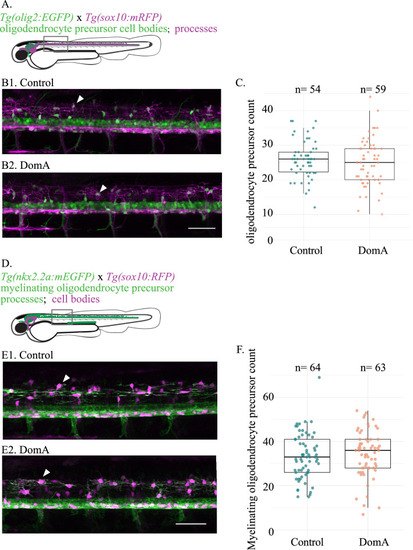
Exposure to DomA at 2 dpf did not reduce the number of oligodendrocyte precursors prior to myelination (A) Diagram of laterally mounted Tg(olig2:EGFP) × Tg(sox10:mRFP) double transgenic larvae with descriptions on the cell types and processes labelled by each transgene. The rectangle delineates the approximate location within the spinal cord where the image was acquired. (B) Representative images of the double transgenic fish, Tg(olig2:EGFP) × Tg(sox10:mRFP), imaged at 2.5 dpf. Control (B1) and DomA-exposed fish (B2). White arrow points to a dorsal oligodendrocyte precursors. (C) Oligodendrocyte precursor count in dorsal spinal cords of the control and DomA-exposed double transgenic fish—Tg(olig2:EGFP) × Tg(sox10:mRFP). Each point represents the number of oligodendrocyte precursors counted within the 403.1 μM imaging area in a single fish (Control—median = 26 and IQR = 6; DomA—median = 25, IQR = 9). Scale bar = 50 μm. (D) Diagram of laterally mounted Tg(nkx2.2a:mEGFP) x Tg(sox10:RFP) double transgenic larvae with descriptions on the cell types and processes labelled by each transgene. The rectangle delineates the approximate location within the spinal cord where the image was acquired. (E) Representative images of the double transgenic fish, Tg(nkx2.2a:mEGFP) × Tg(sox10:RFP), imaged at 2.5 dpf. Control (E1) and DomA exposed fish (E2). White arrow points to a dorsal oligodendrocyte precursors in the myelinating lineage. Scale bar = 50 μm (F) Counts of oligodendrocyte precursors that are fated to myelinate in the dorsal spinal cord in double transgenic fish—Tg(nkx2.2a:mEGFP) × Tg(sox10: RFP). Each point represents the number of oligodendrocyte precursors counted within the 354.3 μM imaging area in a single fish. (Control – median = 33, IQR = 15, DomA – median = 36, IQR = 13). Data shown are from two combined trials. See Supplemental Fig. 1 for data from individual trials. |