
- Title
-
Intraocular delivery of ZIF-90-RhB-GW2580 nanoparticles prevents the progression of photoreceptor degeneration
- Authors
- Cao, P., Cheng, Y., Li, Z., Cheng, Y.J., Chu, X., Geng, C., Yin, X., Li, Y.
- Source
- Full text @ J Nanobiotechnology
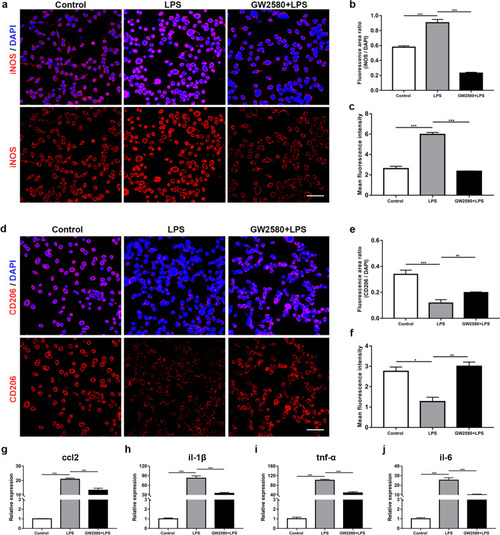
The expression of iNOS, CD206 and proinflammatory factors in BV-2 cells. a Images of iNOS immunofluorescence staining in unstimulated (control group), LPS-stimulated (LPS group) and GW2580-treated (GW2580 + LPS group) BV-2 cells. b, c Quantification of b the ratio of iNOS/DAPI area and c the mean intensity of iNOS-expressing cells (ANOVA; ***P < 0.001). d Images of CD206 immunofluorescence staining in BV-2 cells from the three groups. e, f Quantification of e the ratio of CD206/DAPI area and f the mean intensity of CD206-expressing cells (ANOVA; *P < 0.05, **P < 0.01, ***P < 0.001). g–j The relative expression levels of the proinflammatory factors ccl2, il-1β, tnf-α and il-6 mRNA in BV-2 cells from the three groups (ANOVA; ***P < 0.001). Scale bars in a and d 20 μm |
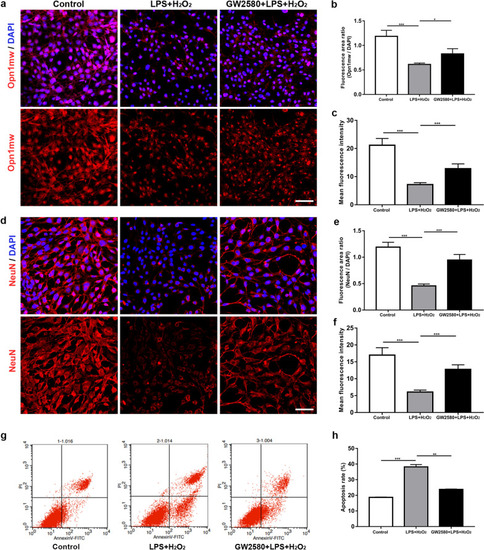
The expression of Opn1mw and NeuN and the apoptosis in 661W cells. a Images of Opn1mw immunofluorescence staining in uninduced 661W cells (control group), H2O2-induced 661W cells cocultured with BV-2 cells following LPS stimulation (LPS + H2O2 group) and H2O2-induced 661W cells cocultured with BV-2 cells following GW2580 treatment and LPS stimulation (GW2580 + LPS + H2O2 group). b, c Statistical analysis of b the ratio of Opn1mw/DAPI area and c the mean intensity of Opn1mw-expressing cells (ANOVA; *P < 0.05, ***P < 0.001). d Images of NeuN immunofluorescence staining in 661W cells from the three groups. e, f Statistical analysis of e the ratio of NeuN/DAPI area and f the mean intensity of NeuN-expressing cells (ANOVA; ***P < 0.001). g Flow cytometry of Annexin V-FITC and propidium iodide (PI) staining in 661W cells from the three groups. h Quantitative analysis of the apoptosis rate (ANOVA; **P < 0.01, ***P < 0.001). Scale bars in a and d: 20 μm |
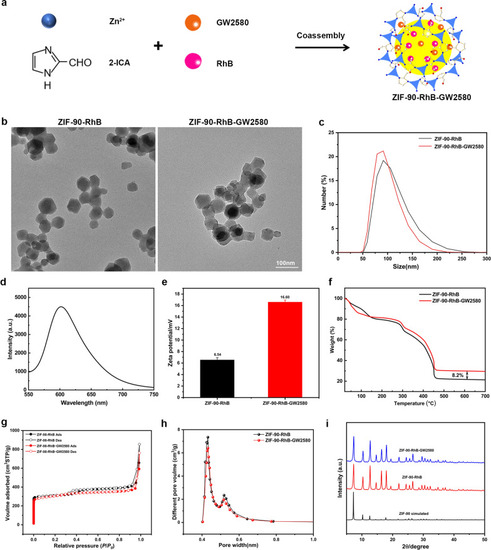
Characterization of ZIF-90-RhB and ZIF-90-RhB-GW2580. a Scheme for the synthesis of ZIF-90-RhB-GW2580 nanoparticles. b TEM images of ZIF-90-RhB and ZIF-90-RhB-GW2580. c DLS of ZIF-90-RhB and ZIF-90-RhB-GW2580 in PBS solution. d Fluorescence spectra of ZIF-90-RhB-GW2580. e Zeta potentials of ZIF-90-RhB (black) and ZIF-90-RhB-GW2580 (red). f Thermogravimetric analysis (TGA) of ZIF-90-RhB (black) and ZIF-90-RhB-GW2580 (red). g Adsorption and desorption isotherms of ZIF-90-RhB (black) and ZIF-90-RhB-GW2580 (red). h Pore size distributions of ZIF-90-RhB (black) and ZIF-90-RhB-GW2580 (red). i X-ray diffraction patterns of ZIF-90-simulated (black), ZIF-90-RhB (red) and ZIF-90-RhB-GW2580 (blue). Scale bar in a: 100 nm |
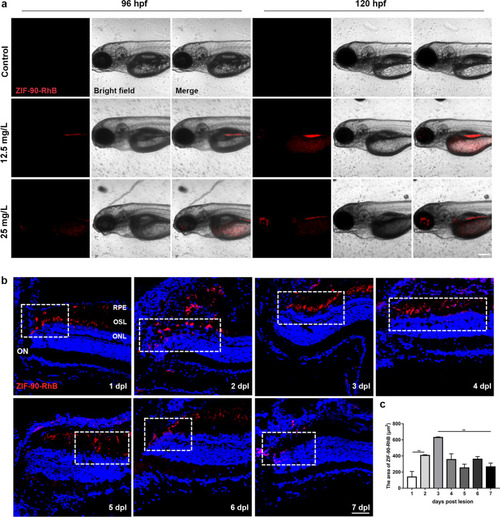
The distribution of ZIF-90-RhB in larval zebrafish and light-lesioned retina. a Bright field and fluorescence images of larval zebrafish following ZIF-90-RhB exposure at 96 and 120 hpf. b Time-lapse localization of ZIF-90-RhB in sections taken from light-lesioned retinas from 1 to 7 days post-lesion (dpl). The lesion sites are indicated by the dotted rectangles. c Quantitative analysis of the fluorescence area (ANOVA; **P < 0.01). Scale bars in a: 500 μm; b: 20 μm. RPE retinal pigment epithelium; OSL outer segment layer; ONL outer nuclear layer; ON optic nerve |
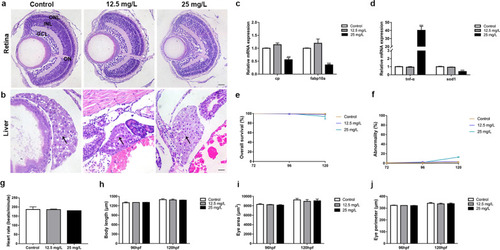
The biotoxicity of ZIF-90-RhB in larval zebrafish. a HE staining of the retina. b HE staining of the liver (arrows). c The relative expression levels of cp and fabp10a (ANOVA; ***P < 0.001). d The relative expression levels of tnf-α and sod1 (ANOVA; ***P < 0.001). e–j Statistical analysis of the e survival rate, f abnormality rate, g heart rate at 120 hpf, h body length, i eye area and j eye perimeter at 96 hpf and 120 hpf. No significant differences were found among the control, 12.5 mg/L- and 25 mg/L-exposed groups (ANOVA). Scale bars in a, b: 50 μm. ONL outer nuclear layer; INL inner nuclear layer; GCL ganglion cell layer; ON optic nerve |
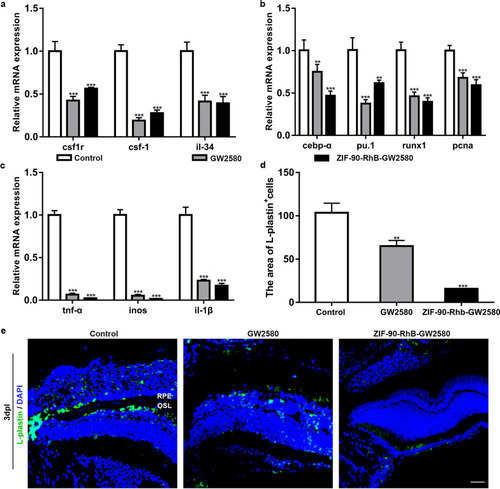
The inhibited microglial activation and the expression of inflammatory factors following ZIF-90-RhB-GW2580 treatment. a qRT‒PCR analysis of the expression levels of csf1r, csf-1 and il-34 in the control, GW2580 and ZIF-90-RhB-GW2580 groups at 3 days post-lesion (dpl) (ANOVA; ***P < 0.001). b, c The relative expression levels of b microglial proliferation-related markers (cebp-α, pu.1, runx1 and pcna) and c proinflammatory factors (tnf-α, inos and il-1β) at 3 dpl (ANOVA; **P < 0.01, ***P < 0.001). d Quantification of the fluorescence area of L-plastin-positive cells in sections taken from retinas in three groups at 3 dpl (ANOVA; **P < 0.01, ***P < 0.001). e Immunofluorescence images of L-plastin at 3 dpl. Scale bar in e: 20 μm. RPE retinal pigment epithelium; OSL outer segment layer |
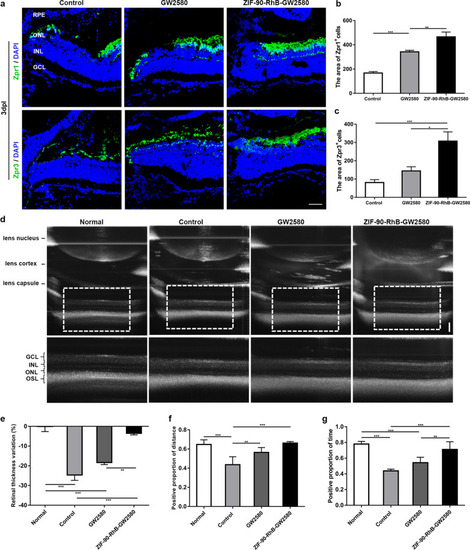
The expression of photoreceptor markers, retinal structure, and optomotor response following treatment with ZIF-90-RhB-GW2580. a Zpr1 and Zpr3 immunofluorescence staining in sections taken from retinas in the control, GW2580 and ZIF-90-RhB-GW2580 groups at 3 days post-lesion (dpl). b, c Quantification of the fluorescence areas of b Zpr1- and c Zpr3-positive cells (ANOVA; *P < 0.05, **P < 0.01, ***P < 0.001). d Images of PS-OCT in retinas from the normal (unlesioned and uninjected), control, GW2580 and ZIF-90-RhB-GW2580 groups at 4 dpl. e Quantitative analysis of the retinal thickness variation (ANOVA; **P < 0.01, ***P < 0.001). f, g The statistical analyses of the f positive proportion of distance and g positive proportion of time at 4 dpl (ANOVA; **P < 0.01, ***P < 0.001). Scale bars in a: 20 μm; d: 100 μm. RPE, retinal pigment epithelium; ONL outer nuclear layer; INL inner nuclear layer; GCL ganglion cell layer; OSL outer segment layer |