
|
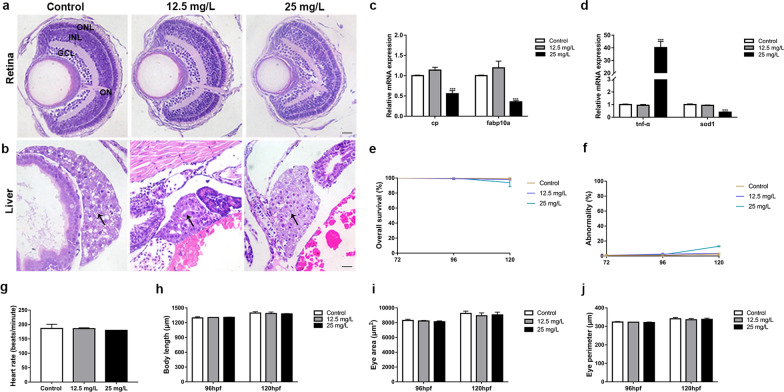
Fig. 5
The biotoxicity of ZIF-90-RhB in larval zebrafish. a HE staining of the retina. b HE staining of the liver (arrows). c The relative expression levels of cp and fabp10a (ANOVA; ***P < 0.001). d The relative expression levels of tnf-α and sod1 (ANOVA; ***P < 0.001). e–j Statistical analysis of the e survival rate, f abnormality rate, g heart rate at 120 hpf, h body length, i eye area and j eye perimeter at 96 hpf and 120 hpf. No significant differences were found among the control, 12.5 mg/L- and 25 mg/L-exposed groups (ANOVA). Scale bars in a, b: 50 μm. ONL outer nuclear layer; INL inner nuclear layer; GCL ganglion cell layer; ON optic nerve