
|
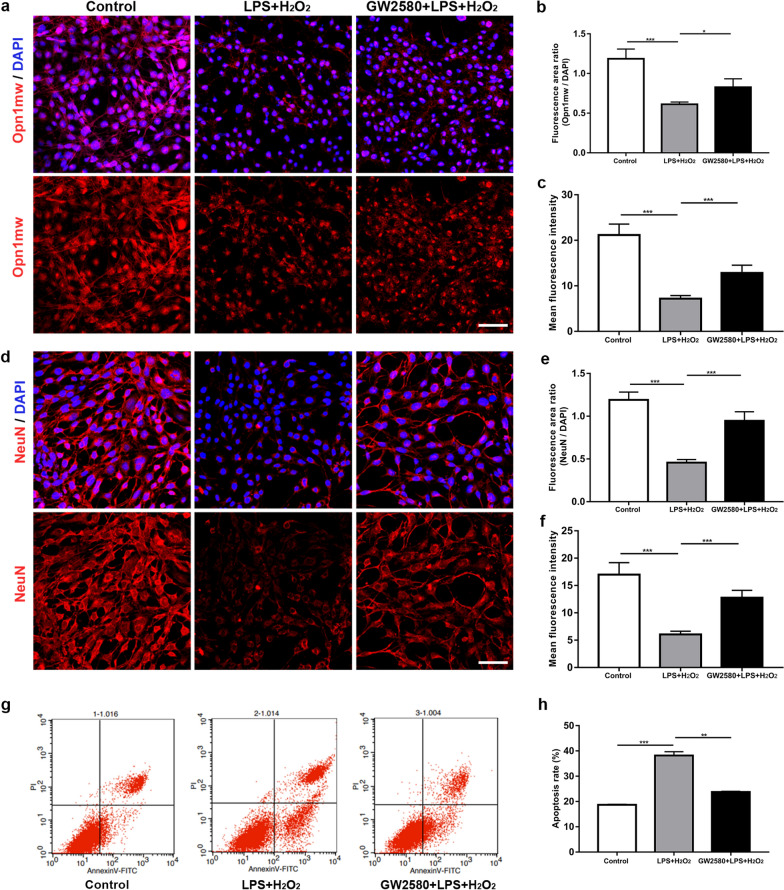
Fig. 2
The expression of Opn1mw and NeuN and the apoptosis in 661W cells. a Images of Opn1mw immunofluorescence staining in uninduced 661W cells (control group), H2O2-induced 661W cells cocultured with BV-2 cells following LPS stimulation (LPS + H2O2 group) and H2O2-induced 661W cells cocultured with BV-2 cells following GW2580 treatment and LPS stimulation (GW2580 + LPS + H2O2 group). b, c Statistical analysis of b the ratio of Opn1mw/DAPI area and c the mean intensity of Opn1mw-expressing cells (ANOVA; *P < 0.05, ***P < 0.001). d Images of NeuN immunofluorescence staining in 661W cells from the three groups. e, f Statistical analysis of e the ratio of NeuN/DAPI area and f the mean intensity of NeuN-expressing cells (ANOVA; ***P < 0.001). g Flow cytometry of Annexin V-FITC and propidium iodide (PI) staining in 661W cells from the three groups. h Quantitative analysis of the apoptosis rate (ANOVA; **P < 0.01, ***P < 0.001). Scale bars in a and d: 20 μm