
|
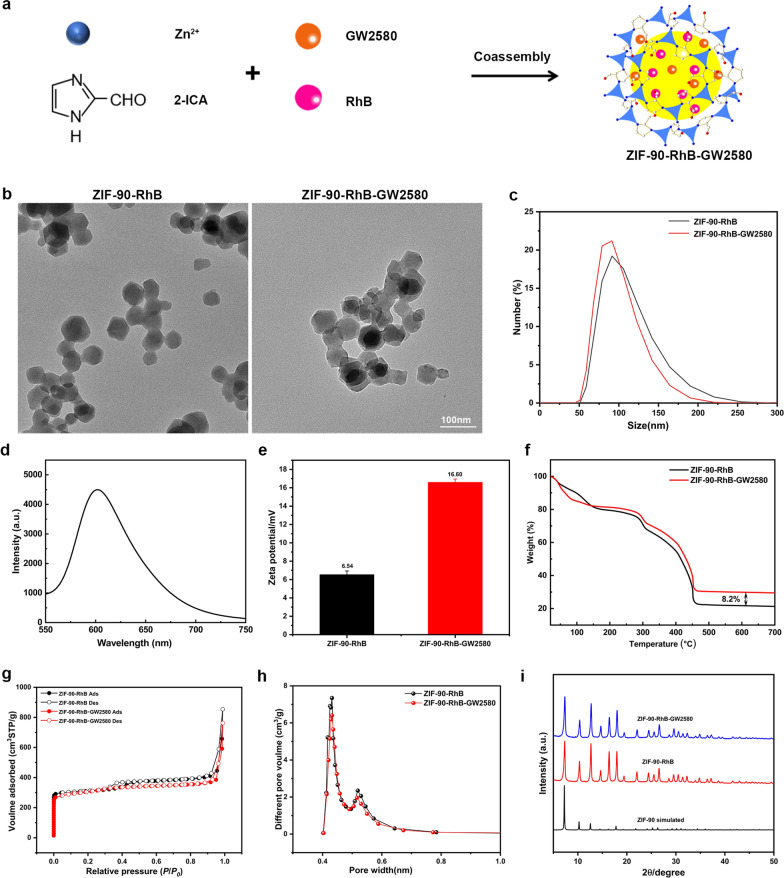
Fig. 3
Characterization of ZIF-90-RhB and ZIF-90-RhB-GW2580. a Scheme for the synthesis of ZIF-90-RhB-GW2580 nanoparticles. b TEM images of ZIF-90-RhB and ZIF-90-RhB-GW2580. c DLS of ZIF-90-RhB and ZIF-90-RhB-GW2580 in PBS solution. d Fluorescence spectra of ZIF-90-RhB-GW2580. e Zeta potentials of ZIF-90-RhB (black) and ZIF-90-RhB-GW2580 (red). f Thermogravimetric analysis (TGA) of ZIF-90-RhB (black) and ZIF-90-RhB-GW2580 (red). g Adsorption and desorption isotherms of ZIF-90-RhB (black) and ZIF-90-RhB-GW2580 (red). h Pore size distributions of ZIF-90-RhB (black) and ZIF-90-RhB-GW2580 (red). i X-ray diffraction patterns of ZIF-90-simulated (black), ZIF-90-RhB (red) and ZIF-90-RhB-GW2580 (blue). Scale bar in a: 100 nm