
|
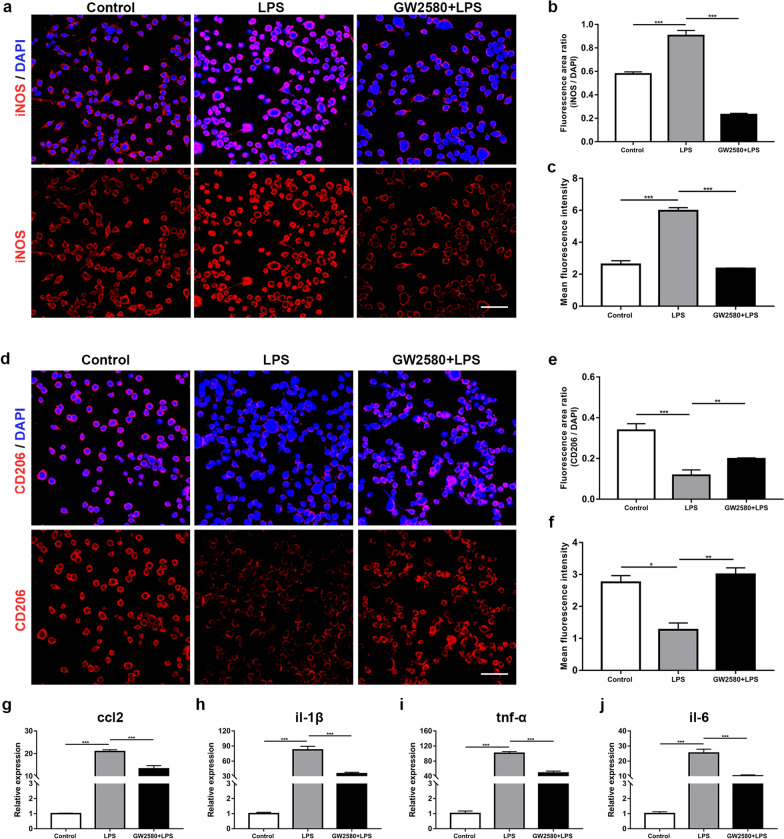
Fig. 1
The expression of iNOS, CD206 and proinflammatory factors in BV-2 cells. a Images of iNOS immunofluorescence staining in unstimulated (control group), LPS-stimulated (LPS group) and GW2580-treated (GW2580 + LPS group) BV-2 cells. b, c Quantification of b the ratio of iNOS/DAPI area and c the mean intensity of iNOS-expressing cells (ANOVA; ***P < 0.001). d Images of CD206 immunofluorescence staining in BV-2 cells from the three groups. e, f Quantification of e the ratio of CD206/DAPI area and f the mean intensity of CD206-expressing cells (ANOVA; *P < 0.05, **P < 0.01, ***P < 0.001). g–j The relative expression levels of the proinflammatory factors ccl2, il-1β, tnf-α and il-6 mRNA in BV-2 cells from the three groups (ANOVA; ***P < 0.001). Scale bars in a and d 20 μm