
- Title
-
X-linked myotubular myopathy is associated with epigenetic alterations and is ameliorated by HDAC inhibition
- Authors
- Volpatti, J.R., Ghahramani-Seno, M.M., Mansat, M., Sabha, N., Sarikaya, E., Goodman, S.J., Chater-Diehl, E., Celik, A., Pannia, E., Froment, C., Combes-Soia, L., Maani, N., Yuki, K.E., Chicanne, G., Uusküla-Reimand, L., Monis, S., Alvi, S.A., Genetti, C.A., Payrastre, B., Beggs, A.H., Bonnemann, C.G., Muntoni, F., Wilson, M.D., Weksberg, R., Viaud, J., Dowling, J.J.
- Source
- Full text @ Acta Neuropathol.
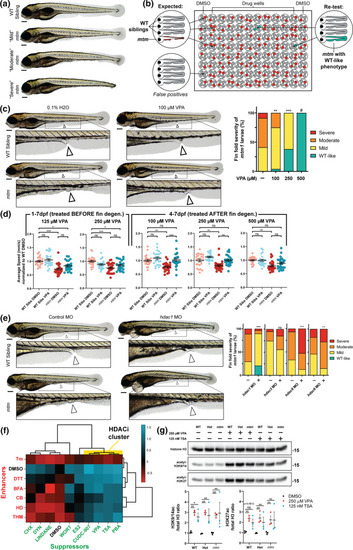
Phenotypic screen of mtm mutants identifies sodium valproate (VPA) as a suppressor of fin degeneration. a mtm1Δ8/Δ8 mutants (mtm) exhibit a spectrum of larval fin fold degeneration at 4 dpf, ranging from mild to severe. b Schematic of the unbiased screen designed to identify chemicals that suppress mtm fin degeneration. In total, 1280 chemicals were screened. c VPA was identified as a suppressor in the screen when larvae were exposed from 1 to 4 dpf. Escalating VPA concentrations show increasing effectiveness in suppressing fin degeneration. (Kruskal–Wallis test with Dunn’s post-test; Mean ± SEM; n = 68,24,21,0). #Note: no mutants were identified at 500 μM concentration; however there is considerable developmental toxicity at this concentration. 1 mM VPA is lethal to all fish exposed from 1 to 4 dpf. d VPA exposure promotes improvement in the motor activity of mtm mutants (2-way ANOVA with Tukey’s post-test; n = 22–24 larvae each group). To account for a potential advantage of having intact fin folds due to rescue by VPA, motor behavior was assessed after fins degenerated using severe mtm larvae only. e Morpholino knockdown of hdac1 (zebrafish ortholog of human HDAC1/2) suppresses fin degeneration in mtm mutants. However, knockdown of class I hdac3 and hdac8, or class II hdac6, failed to suppress the phenotype (two-tailed Mann–Whitney test; n = 29–90). f Chemical-chemical fingerprint reveals a common mode of action between VPA and HDAC inhibitors PBA, TSA (trichostatin A), and CUDC-907 in suppressing the fin phenotype (HDACi cluster in yellow) when combined with “enhancer” chemicals that worsen mtm fin degeneration. Other suppressors do not overcome the effects of enhancers, suggesting different mechanisms of suppression are involved. g Western blot reveals that larvae exposed to VPA and TSA have elevated levels of acetylated histones, consistent with HDAC inhibitor activity. Statistics: *p < 0.05, **p < 0.01, ***p < 0.001 |
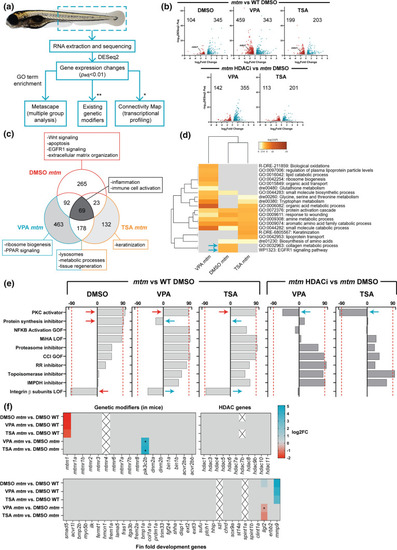
Comparative transcriptomics in mtm mutants treated with HDAC inhibitors. a Schematic outlining the analyses performed (*genes needed to be converted to human orthologs; **zebrafish orthologs of genetic modifiers identified previously in Mtm1-/y mice). b Volcano plots showing differentially expressed genes (DEGs) between groups of interest (adjusted p value < 0.01, log2FC > 0.585). c Venn diagram highlighting DEGs that are shared or unique to each group and their associated GO enrichment terms. d Heat map visualization of GO terms enriched in mtm groups vs WT DMSO controls. Gray indicates lack of significance. e Connectivity scores generated by comparing the top DEGs (up to 300) from each group with the perturbagen-induced gene signature profiles in Connectivity Map. Scores > 90 indicate a high degree of similarity between queried gene lists and experimentally determined transcriptional responses to chemical or genetic perturbagens. The transcriptional signature of mtm mutants closely emulates that of human cell lines treated with protein kinase C (PKC) activators. f Heat maps showing expression changes in hypothetical modifier genes. Zebrafish orthologs of known genetic modifiers of Mtm1 in mice (*padj = 0.017, 0.015), HDAC genes, and genes involved in larval zebrafish fin fold development (*padj = 0.065) were considered. Gray indicates genes did not meet cut-offs and crossed boxes show genes that were not detected. Overall, none of these modifiers alone may account for the observed rescue |
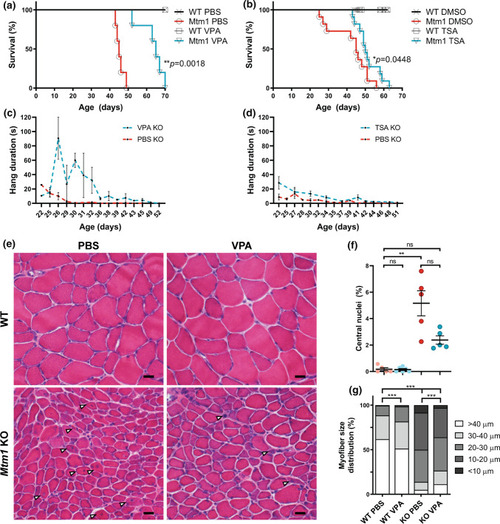
HDAC inhibitors improve phenotypic outcomes in Mtm1 KO mice. a, b Valproic acid (VPA) treatment starting at 21 days promotes significant improvement in Mtm1 KO survival [median survival 65 days (n = 5) vs. 45 days for Mtm1 KOs + PBS (n = 5), **p < 0.01]. VPA improves strength as measured by wire hang duration (n = 2–4 per timepoint; best-fit curves by least squares regression are different, p = 0.0002). c, d Trichostatin A (TSA) has a measurable, yet much less positive, effect on KO mice. TSA treatment starting at 21 days promotes significant improvement in Mtm1 KO survival [median survival 50 days (n = 10) vs. 45 days for Mtm1 KOs + DMSO (n = 11), *p < 0.05]. TSA improves strength as measured by wire hang duration (n = 2–11 per timepoint; best-fit curves by least squares regression are different, p < 0.001). e, f Tibialis anterior muscle cross-sections at 35 days stained with haematoxylin and eosin (scale bar = 20 µm). VPA treatment is associated with a reduction in number of centrally nucleated fibres that is not significant. From left to right, Mean % central nuclei ± SEM are 0.17 ± 0.11%, 0.15 ± 0.07%, 5.20 ± 0.95%, 2.40 ± 0.32%; n = 1836, 2069, 6983, 6167 total fibres counted across 6–10 different fields from n = 5 to 6 animals; Kruskal–Wallis test with Dunn’s post-test; **p < 0.01. g VPA treatment significantly improves myofiber diameter size in Mtm1 KO mice as measured by minimum Feret’s diameter. From left to right, Mean Feret’s diameter ± S.E.M are: 45.54 ± 0.388, 42.16 ± 0.332, 21.39 ± 0.185, 25.39 ± 0.224, respectively. From left to right, % myofiber size distribution for < 10 μm/10–20 μm/20–30 μm/30–40 μm/ > 40 μm bins are: 0/0.497/11.019/26.678/61.806; 0.0633/1.456/16.835/30.380/51.266; 8.358/41.605/36.119/8.873/5.044; 3.033/33.037/37.323/15.326/11.282; n = 1207, 1580, 2716, 2473 total fibers measured across three different sections from n = 5–6 animals; Kruskal–Wallis test with Dunn’s post-test; ***p < 0.001 |
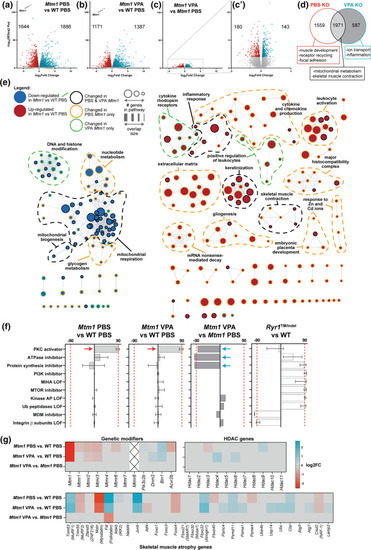
Comparative transcriptomics in Mtm1 KO mice treated with VPA. Bulk RNA sequencing was performed on RNA extracts from tibialis anterior muscle from 35 day old mice, either treated with PBS or valproic acid (VPA) starting at 21 days. a–c Volcano plots showing differentially expressed genes (DEGs) between groups of interest (adjusted p value < 0.01, log2FC > 0.585). d Venn diagram highlighting DEGs that are shared or unique to each Mtm1 KO treatment group compared to WT PBS and their associated GO enrichment terms. e Visualization of enriched GO terms in each group. Nodes specific to VPA KO are indicated with green outlines, while those specific to PBS KO are outlined in orange. f Connectivity scores generated by comparing the top DEGs (up to 300) from each group with the perturbagen-induced gene signature profiles in Connectivity Map. The transcriptional signature of Mtm1 KOs closely emulates that of human cell lines treated with protein kinase C (PKC) activators. This signature is not detected in an age-matched mouse model of recessive Ryr1-related myopathy. g Heat maps showing expression changes in putative modifier genes. Gray indicates genes that did not meet cut-offs (padj < 0.01) and crossed boxes show genes that were not detected. The data shows that changes in the expression of modifier genes is unlikely to account for the benefit provided by VPA treatment |

TGF beta signalling is altered in Mtm1 KO mice and improved with VPA. a, b Heat maps showing expression changes (as determined with RNA sequencing) in AP-1 pathway genes in mtm zebrafish and Mtm1 KO mice, respectively. c p-SMAD 2/3 immunofluorescence on tibialis anterior muscle at 35 days of age. d Quantification of p-SMAD 2/3 immunostaining. An increased proportion of myofibers with nuclear p-SMAD is observed in Mtm1 KO mice. Values are Mean ± SEM. p-SMAD2/3 fraction of positive nuclei (WT + PBS &KO + PBS n = 6, WT + VPA n = 5, KO + VPA n = 7). PBS treated Mtm1 = 11 ± 1 vs PBS treated WT = 1.7 ± 0.8, (****p < 0.0001) vs VPA treated Mtm1 KOs = 1.6 ± 0.95 (****p < 0.0001) vs VPA treated WTs = 1.0 ± 0.45 (****p < 0.0001). Note that staining was confirmed to be within myofibers using double IIF with anti-dystrophin. e Heat map showing expression changes in follistatin interacting gene products in Mtm1 KO mice. For all heat maps, grey indicates genes that did not meet cut-offs (padj < 0.01), and crossed boxes show genes that were not detected. Statistical analysis by one-way ANOVA using Dunnett's multiple comparisons test. Scale bar = 20 μm |
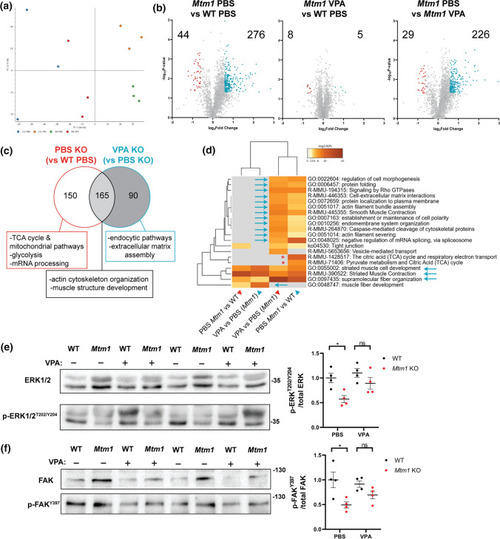
Comparative proteomics in Mtm1 KO mice treated with VPA. Proteomes were obtained from 35 day old skeletal muscle extracts. a Principal component analysis (PCA) plot of each group showing that protein expression of VPA treated KO mice is more similar to WT controls than it is to PBS treated KOs. b Volcano plots showing differentially expressed proteins (DEPs) between groups of interest (p value < 0.05, log2FC > 0.585). c Venn diagram highlighting DEPs that are shared or unique to PBS KOs and selected associated GO enrichment terms. Given that only 13 DEPs were identified between VPA KO and WT PBS, this comparison highlights changes primarily between KOs. d Heat map visualization of enriched GO terms. Arrows indicate pathways that were improved by VPA treatment. e Western blot showing VPA treatment increases p-ERKT202/Y204 levels in Mtm1 KOs (Two-way ANOVA with Tukey’s post-test; n = 4 each). f Western blot showing VPA treatment increases p-FAKY397 levels in Mtm1 KOs (Two-way ANOVA with Tukey’s post-test; n = 4 each) |
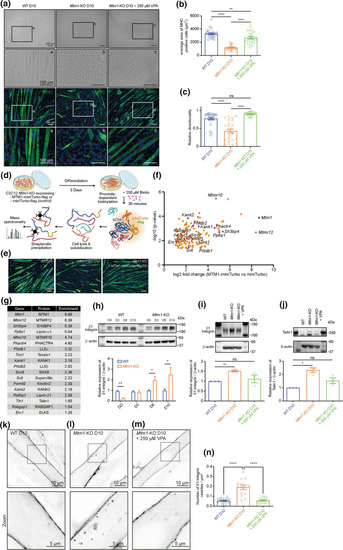
VPA rescues differentiation arrest and β1-integrin alterations in Mtm1-KO myotubes. a Brightfield of MHC and DAPI staining of differentiated C2C12 myotubes (D10) showing that VPA rescues the aberrant differentiation and reduced size observed in Mtm1-KO cells. Scale bars, 100 μm. a–c are higher magnifications of the indicated areas shown as boxes. b Average area of MHC labeled WT, Mtm1-KO and Mtm1-KO VPA-treated cells after 10 days of differentiation. Data are represented as Mean ± SEM, n = 5, 5 fields per independent experiment, each point represents one field of view, ****p < 0.0001 and **p < 0.01, one-way ANOVA test and Šídák's multiple comparisons test. c Relative directionality of WT, Mtm1-KO and Mtm1-KO VPA-treated cells after 10 days of differentiation. Data are represented as Mean ± SEM, n = 5 fields per independent experiment, each point represents one field of view, ns not significant and ****p < 0.0001, one-way ANOVA test and Šídák's multiple comparisons test. d BioID workflow for the identification of an MTM1 interactome. e MHC staining of WT, Mtm1-KO and Mtm1-KO expressing MTM1-miniTurbo-flag myotubes after the indicated days of differentiation, showing that miniTurbo does not affect MTM1 function. Scale bar, 100 μm. f Identification of candidate interactors by quantitative mass spectrometry. Volcano plot depicting quantified proteins (gene names). The x axis shows the average fold change (log2) in protein abundance in MTM1-miniTurbo samples in comparison to miniTurbo controls, and the y axis shows the –log10 (p value); data for both were determined by results from three independent experiments. Significantly enriched proteins in the MTM1-miniTurbo condition are displayed in orange, MTM1 bait protein displayed in blue, and known MTM1 partners in green. Proteins (gene names) related to β1-integrin trafficking in purple. g Enrichment (abundance ratios as log2 values (MTM1-miniTurbo—miniTurbo)) of peptides from three independent experiments (mean) related to MTM1 and β1-integrin trafficking. h Top: expression of β1-integrin in WT and Mtm1-KO C2C12 cells at the indicated differentiation time points (n = 3 independent experiments). Bottom: quantification of β1-integrin expression analyzed by Western. Data are represented as Mean ± SEM, n = 3, *p < 0.05 and **p < 0.01 according to Student’s t test. i Top: expression of β1-integrin of WT, Mtm1-KO, Mtm1-KO VPA-treated C2C12 cells after 10 days of differentiation (n = 3 independent experiments). Bottom: quantification of β1-integrin expression. ns not significant and **p < 0.01 according to Student’s t test. j Top: expression of Talin1 of WT, Mtm1-KO, Mtm1-KO VPA-treated C2C12 cells after 10 days of differentiation (n = 3 independent experiments). Bottom: quantification of Talin expression. ns not significant and **p < 0.01 according to Student’s t test. Top: representative confocal images of β1-integrin distribution from 10-days differentiated WT (k), Mtm1-KO (l) and Mtm1-KO C2C12 myotubes ± 250 µM VPA (m). Scale bar, 10 μm. Bottom: higher magnifications of the boxed area shown on the top. Scale bar, 5 μm. n Quantification of β1-integrin vesicles density (Mean ± SEM, n = 3, 5 fields per independent experiment, each point represents one field of view, ****p < 0.0001 according to one-way ANOVA test and Šídák's multiple comparisons test |
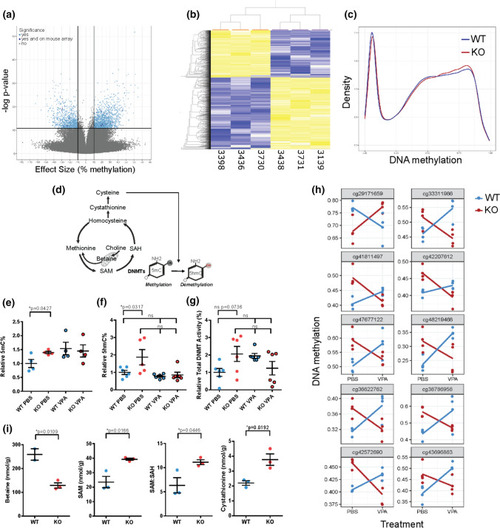
DNA methylation changes and 1-carbon metabolites in Mtm1 KO mice. a Volcano plot of CpGs differentially methylated between Mtm1 KO mice and WTs, assayed using RRBS. CpGs in light blue met a statistical threshold of 10% mean methylation difference between groups and FDR corrected **p value < 0.01. 27 CpGs in dark blue were significant on RRBS and were located within 1 kb of a significant CpGs on the mouse array. b Heatmap of the 2,424 CpGs identified using RRBS. Samples (n = 3 Mtm1 KO mice and n = 3 WT) are ordered by hierarchical clustering, which shows two main clusters corresponding to genotype. c Density plot of all mouse array CpGs averaged across WT and Mtm1 KO (n = 4 per genotype). WT distribution shows lower peak at methylated CpGs and higher peak at unmethylated CpGs, consistent with a global increase in DNA methylation in KO mice. d Schematic of 1-carbon metabolism and related DNA (hydroxy)methylation processes. e 5-methylcytosine (5mC) based ELISA shows an increase in global DNA methylation in untreated KO mouse muscle and similar levels in WT vs KO muscle treated with VPA. Values are Mean ± SEM, n = 4 per group. WT + PBS vs Mtm1 KO + PBS, 3.2 ± 0.47, 4.47 ± 0.14, *p < 0.05 by Student’s T test. WT + VPA 4.93 ± 0.71 and KO + VPA 4.65 ± 0.7, one-way ANOVA followed by Šídák's multiple comparisons test. Values are relative to WT + PBS controls. f 5-hydroxymethycytosine (5-hmC) based ELSA shows increased 5-hmC% in hamstring muscle of Mtm1 KO compared to WT mice that is ameliorated with VPA treatment. Values are Mean ± SEM relative to WT + PBS controls. n = 6 per group. WT + PBS vs KO + PBS, 1.0 ± 0.12, 1.87 ± 0.44, *p < 0.05 by one-way ANOVA followed by Šídák's multiple comparisons test. WT + VPA 0.77 ± .0.06 and KO + VPA 0.85 ± 0.16 are not different from WT + PBS controls. g Total DNMT enzymatic activity is not significantly increased in hamstring muscle of Mtm1 KO + PBS compared to WT + PBS mice. Values are Mean ± SEM relative to WT + PBS controls n = 6 per group. WT + PBS vs KO + PBS, 1.0 ± 0.23, 2.06 ± 0.43, p = 0.0736 by one-way ANOVA followed by Dunnett’s post-hoc test. WT + VPA 1.95 ± .14 and KO + VPA 1.24 ± 0.39. h 10 CpGs with highest p-values, identified by modelling an interaction between genotype and VPA treatment (160 CpGs total nominal p value < 0.01 and methylation difference > 5%), in mouse array data. Most sites exhibiting hypermethylation in KOs are corrected by VPA treatment. i 1-carbon metabolites measured in muscle of 35 day old WT vs Mtm1 KO mice. Mtm1 KO mice have lower concentrations of betaine, higher concentration of SAM, and a higher SAM/SAH ratio. Values are Mean ± SEM, n = 2–3 per group. WT vs Mtm1 KO, Betaine 259 ± 24, 128.8 ± 10.9, *p < 0.05; SAM 25.53 ± 3.88, 39.23 ± 0.76; SAH 3.83 ± 0.27, 3.53 ± 0.14; SAM:SAH 6.33 ± 1.59, 11.13 ± 0.50, *p < 0.05; Cystathionine 2.2 ± 0.14, 3.8 ± 0.39, *p < 0.05. Significance detected by Student’s T test |
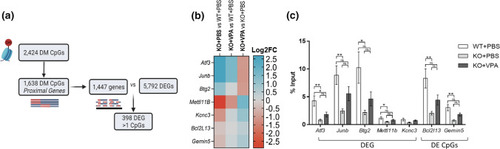
Epigenetic signatures associate with transcriptomic changes in Mtm1 KO mice. a Workflow analysis to identify the correlation between differentially methylated (DM) CpGs identified by RRBS with total differentially expressed genes (DEGs) identified by RNAseq in Mtm1 KO mouse muscle. Of the 2434 DM CpGs, 1638 mapped to various features of proximal genes, encompassing 1447 known gene targets. Within these 1447 genes, a total of 398 had significantly altered expression. b Heat map showing Log2FC of target genes selected for ChIP-qPCR experiment. All genes were DEG in KO + PBS vs WT + PBS mice (FDR **padj < 0.01) and their expression was modulated by VPA treatment. Blue indicates increased expression; red indicates decreased expression between comparisons. d ChIP-qPCR data on selected DEGs or genes with DM CpGs calculated as % input of DNA. WT mice exhibit widespread increases in H3k27ac enrichment compared to KO + PBS that is modulated by VPA. n = 6 biological replicate per group with n = 3 technical replicates per qPCR experiment. Values are expressed as Mean ± SEM. Analyses performed using one-way ANOVA at *p < 0.05 |
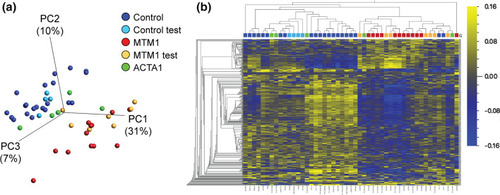
DNA methylation changes in XLMTM patients. a Principal component plot of 416 CpG sites identified as differentially methylated in XLMTM (data generated on Illumina EPIC array platform). n = 12 discovery samples were used to identify signature (plotted in red), with n = 21 discovery “control” males (dark blue). Test samples used to validate the differential methylation signature include n = 7 additional XLMTM cases (MTM1 test; orange), n = 4 additional controls (Control test; light blue) and n = 5 ACTA1 samples (green). Axes represent the first three principal components (PCs) and the total variability for which they account. b Heatmap and hierarchical clustering of the CpG sites and samples plotted in a. Each column represents a patient sample (coloured as in a) and each row represents a single CpG (both ordered by Euclidean clustering). Heatmap colors represent scaled and mean centered percent methylation |