
|
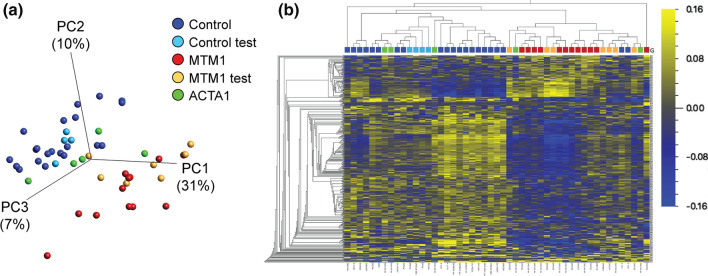
Fig. 10
DNA methylation changes in XLMTM patients. a Principal component plot of 416 CpG sites identified as differentially methylated in XLMTM (data generated on Illumina EPIC array platform). n = 12 discovery samples were used to identify signature (plotted in red), with n = 21 discovery “control” males (dark blue). Test samples used to validate the differential methylation signature include n = 7 additional XLMTM cases (MTM1 test; orange), n = 4 additional controls (Control test; light blue) and n = 5 ACTA1 samples (green). Axes represent the first three principal components (PCs) and the total variability for which they account. b Heatmap and hierarchical clustering of the CpG sites and samples plotted in a. Each column represents a patient sample (coloured as in a) and each row represents a single CpG (both ordered by Euclidean clustering). Heatmap colors represent scaled and mean centered percent methylation