
|
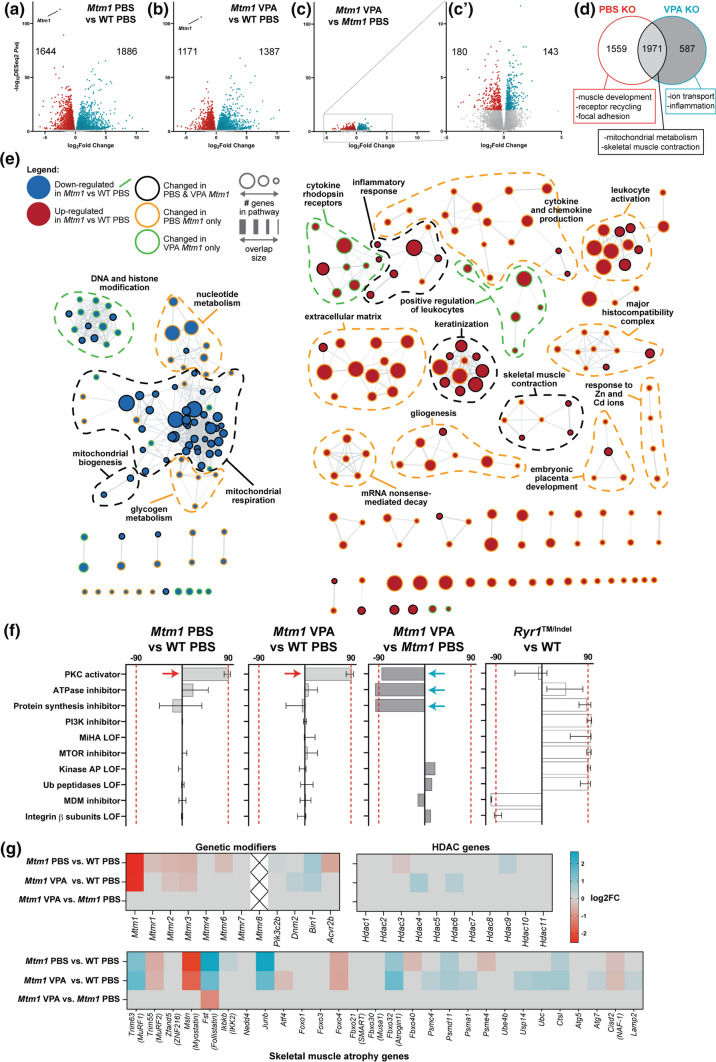
Fig. 4
Comparative transcriptomics in Mtm1 KO mice treated with VPA. Bulk RNA sequencing was performed on RNA extracts from tibialis anterior muscle from 35 day old mice, either treated with PBS or valproic acid (VPA) starting at 21 days. a–c Volcano plots showing differentially expressed genes (DEGs) between groups of interest (adjusted p value < 0.01, log2FC > 0.585). d Venn diagram highlighting DEGs that are shared or unique to each Mtm1 KO treatment group compared to WT PBS and their associated GO enrichment terms. e Visualization of enriched GO terms in each group. Nodes specific to VPA KO are indicated with green outlines, while those specific to PBS KO are outlined in orange. f Connectivity scores generated by comparing the top DEGs (up to 300) from each group with the perturbagen-induced gene signature profiles in Connectivity Map. The transcriptional signature of Mtm1 KOs closely emulates that of human cell lines treated with protein kinase C (PKC) activators. This signature is not detected in an age-matched mouse model of recessive Ryr1-related myopathy. g Heat maps showing expression changes in putative modifier genes. Gray indicates genes that did not meet cut-offs (padj < 0.01) and crossed boxes show genes that were not detected. The data shows that changes in the expression of modifier genes is unlikely to account for the benefit provided by VPA treatment