
|
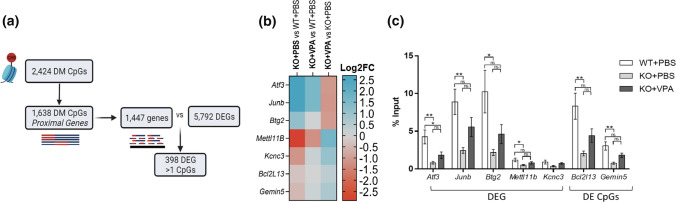
Fig. 9
Epigenetic signatures associate with transcriptomic changes in Mtm1 KO mice. a Workflow analysis to identify the correlation between differentially methylated (DM) CpGs identified by RRBS with total differentially expressed genes (DEGs) identified by RNAseq in Mtm1 KO mouse muscle. Of the 2434 DM CpGs, 1638 mapped to various features of proximal genes, encompassing 1447 known gene targets. Within these 1447 genes, a total of 398 had significantly altered expression. b Heat map showing Log2FC of target genes selected for ChIP-qPCR experiment. All genes were DEG in KO + PBS vs WT + PBS mice (FDR **padj < 0.01) and their expression was modulated by VPA treatment. Blue indicates increased expression; red indicates decreased expression between comparisons. d ChIP-qPCR data on selected DEGs or genes with DM CpGs calculated as % input of DNA. WT mice exhibit widespread increases in H3k27ac enrichment compared to KO + PBS that is modulated by VPA. n = 6 biological replicate per group with n = 3 technical replicates per qPCR experiment. Values are expressed as Mean ± SEM. Analyses performed using one-way ANOVA at *p < 0.05