
Fig. 8
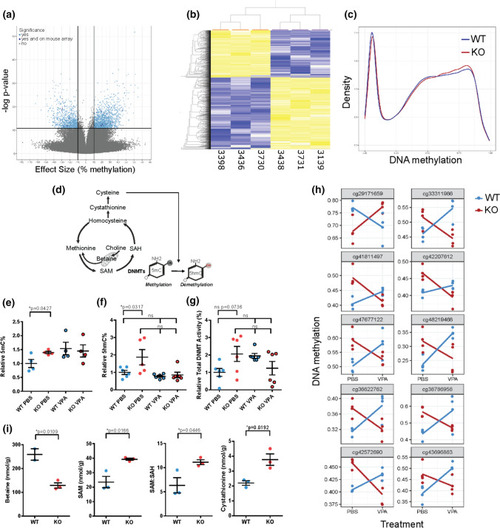
DNA methylation changes and 1-carbon metabolites in Mtm1 KO mice. a Volcano plot of CpGs differentially methylated between Mtm1 KO mice and WTs, assayed using RRBS. CpGs in light blue met a statistical threshold of 10% mean methylation difference between groups and FDR corrected **p value < 0.01. 27 CpGs in dark blue were significant on RRBS and were located within 1 kb of a significant CpGs on the mouse array. b Heatmap of the 2,424 CpGs identified using RRBS. Samples (n = 3 Mtm1 KO mice and n = 3 WT) are ordered by hierarchical clustering, which shows two main clusters corresponding to genotype. c Density plot of all mouse array CpGs averaged across WT and Mtm1 KO (n = 4 per genotype). WT distribution shows lower peak at methylated CpGs and higher peak at unmethylated CpGs, consistent with a global increase in DNA methylation in KO mice. d Schematic of 1-carbon metabolism and related DNA (hydroxy)methylation processes. e 5-methylcytosine (5mC) based ELISA shows an increase in global DNA methylation in untreated KO mouse muscle and similar levels in WT vs KO muscle treated with VPA. Values are Mean ± SEM, n = 4 per group. WT + PBS vs Mtm1 KO + PBS, 3.2 ± 0.47, 4.47 ± 0.14, *p < 0.05 by Student’s T test. WT + VPA 4.93 ± 0.71 and KO + VPA 4.65 ± 0.7, one-way ANOVA followed by Šídák's multiple comparisons test. Values are relative to WT + PBS controls. f 5-hydroxymethycytosine (5-hmC) based ELSA shows increased 5-hmC% in hamstring muscle of Mtm1 KO compared to WT mice that is ameliorated with VPA treatment. Values are Mean ± SEM relative to WT + PBS controls. n = 6 per group. WT + PBS vs KO + PBS, 1.0 ± 0.12, 1.87 ± 0.44, *p < 0.05 by one-way ANOVA followed by Šídák's multiple comparisons test. WT + VPA 0.77 ± .0.06 and KO + VPA 0.85 ± 0.16 are not different from WT + PBS controls. g Total DNMT enzymatic activity is not significantly increased in hamstring muscle of Mtm1 KO + PBS compared to WT + PBS mice. Values are Mean ± SEM relative to WT + PBS controls n = 6 per group. WT + PBS vs KO + PBS, 1.0 ± 0.23, 2.06 ± 0.43, p = 0.0736 by one-way ANOVA followed by Dunnett’s post-hoc test. WT + VPA 1.95 ± .14 and KO + VPA 1.24 ± 0.39. h 10 CpGs with highest p-values, identified by modelling an interaction between genotype and VPA treatment (160 CpGs total nominal p value < 0.01 and methylation difference > 5%), in mouse array data. Most sites exhibiting hypermethylation in KOs are corrected by VPA treatment. i 1-carbon metabolites measured in muscle of 35 day old WT vs Mtm1 KO mice. Mtm1 KO mice have lower concentrations of betaine, higher concentration of SAM, and a higher SAM/SAH ratio. Values are Mean ± SEM, n = 2–3 per group. WT vs Mtm1 KO, Betaine 259 ± 24, 128.8 ± 10.9, *p < 0.05; SAM 25.53 ± 3.88, 39.23 ± 0.76; SAH 3.83 ± 0.27, 3.53 ± 0.14; SAM:SAH 6.33 ± 1.59, 11.13 ± 0.50, *p < 0.05; Cystathionine 2.2 ± 0.14, 3.8 ± 0.39, *p < 0.05. Significance detected by Student’s T test |