
- Title
-
Deleterious Variation in BR Serine/Threonine Kinase 2 Classified a Subtype of Autism
- Authors
- Deng, J., Wang, Y., Hu, M., Lin, J., Li, Q., Liu, C., Xu, X.
- Source
- Full text @ Front. Mol. Neurosci.
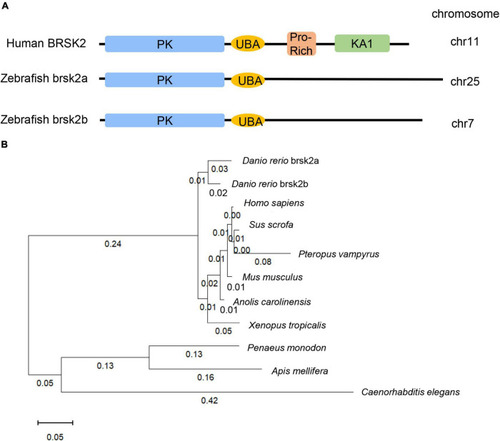
3dpf and brain tissues of Conserved and homologous analysis of BRSK2. (A) Comparisons of protein structure and conserved domain between human BRSK2 and zebrafish brsk2a, brsk2b. The corresponding gene BRSK2 (NC_000011.10) locates at chr 11, brsk2a (NC_007136.7) locates at chr 25, brsk2b (NC_007118.7) locates at chr 7. (B) Phylogenetic analysis of BRSK2 in 10 species. The numbers on the phylogenetic tree represent evolutionary relationships, with larger numbers indicating greater genetic differences. Homo sapiens: NP_001243556.1, Sus scrofa: XP_020938244.1, Pteropus vampyrus: XP_023381426.1, Mus musclulus: NP_001009929.1, Anolis carolinensis: XP_016848950.1, Danio rerio brsk2a: XP_017209740.1, Danio rerio brsk2b: XP_009301703.1, Xenopus tropicalis: XP_004913521.1, Penaeus monodon: XP_037797337.1, Apis mellifera: XP_006557814.2, Caenorhabditis elegans: NP_001076761.1. |

Generation of brsk2b mutant zebrafish. (A) Sanger sequencing and computational modeling of wild-type and mutant brsk2b in zebrafish. (B) The protein structures of brsk2b before and after variation by CRISPR/Cas9. (C) RT-qPCR showed a decrease in brsk2b mRNA expression in brsk2b mutant zebrafish (n = 4 for each genotype, p < 0.0001). (D) RT-qPCR showed no significant difference in brsk2a mRNA expression level between wild-type and brsk2b mutant zebrafish (n = 4 for each genotype, p = 0.847). Groups were statistically compared using an unpaired Student’s t-test. Data are shown as mean ± SEM, ****p < 0.001. |
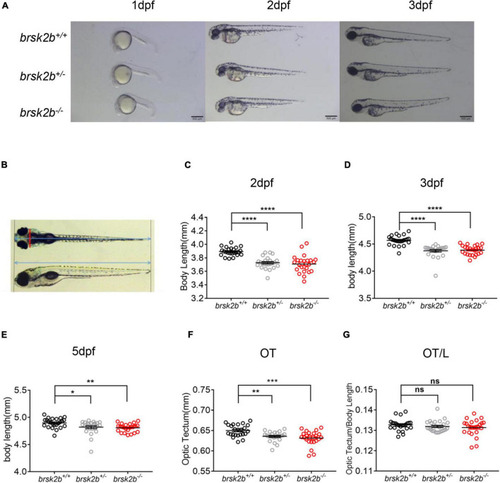
brsk2b-deficient zebrafish displayed developmental delay. (A) Lateral images of brsk2b+/+, brsk2b±, brsk2b–/– larvae at 1, 2, 3 dpf. Scale bars 500 μm. (B) The optic tectum (OT) and body length (L) were measured from lateral and dorsal images using ImageJ. The red line represents OT, and the blue lines represent body length. (C–E) The body lengths of brsk2b–/– larvae at 2 dpf (C), 3 dpf (D), 5 dpf (E) were significantly shorter than that of brsk2b+/+ larvae (n = 24 for each genotype, p = 0.0001, 0.0001, and 0.0043, respectively). (F) The values of OT of brsk2b–/– larvae at 5 dpf were smaller compared to that of brsk2b+/+ larvae (n = 24 for each genotype, p = 0.0001). (G) The ratio of OT/L in three genotypes didn’t show significant difference at 5 dpf (brsk2b+/+: brsk2b±: brsk2b–/– = 24: 23: 22, p = 0.385). Groups were compared using a one-way ANOVA followed by a Dunnett’s multiple comparisons test. Data are shown as mean ± SEM, *p < 0.05, **p < 0.01, ***p < 0.001, ****p < 0.0001. |
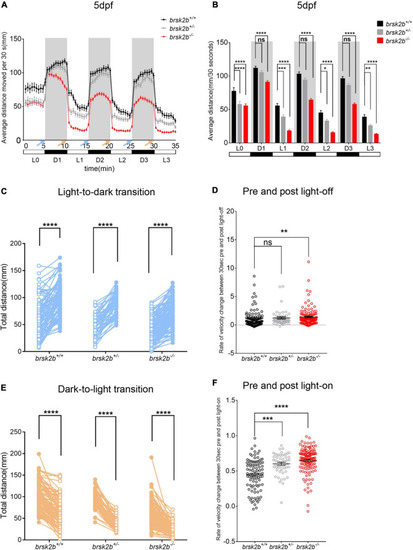
The light/dark test of brsk2b+/+, brsk2b± and brsk2b–/– larvae at 5 dpf. (A,B) The activity of brsk2b–/– larvae was significantly reduced in both light and dark phases compared to brsk2b± and brsk2b+/+ fish. The activity was analyzed for the latter 5 min of light period (L0) and three 5-min of dark/light cycles (D1, L1, D2, L2, D3, L3). Blue arrows indicate light-to-dark transition and orange arrows indicate dark-to-light transition (brsk2b+/+: brsk2b±: brsk2b–/– = 89: 52: 128). Data are presented as mean ± SEM. Within groups were compared using one-way ANOVA and Dunnett’s multiple comparisons tests. (C) Paired dot plots compared average swimming distances per larva of the three light conversions in the 30 s before and after the three light-to-dark conversions (brsk2b+/+: brsk2b±: brsk2b–/– = 89: 52: 128). Within genotype comparisons were conducted by paired t-tests. (D) Box plots compared average rate of velocity change in the 30 s before and after the lights-off. Boxes denote the median, 1st and 3rd quartile, while whiskers represent the minimum and maximum values. Groups were statistically compared using Kruskal–Wallis ANOVA. (E) Paired dot plots compared average swimming distances per larva of the three light conversions in the 30 s before and after the three dark-to-light conversions (brsk2b+/+: brsk2b±: brsk2b–/– = 89: 52: 128). Within genotype comparisons were conducted by paired t-tests. (F) Box plots compared average rate of velocity change in the 30 s before and after the lights-on. Boxes denote the median, 1st and 3rd quartile, while whiskers represent the minimum and maximum values. Groups were statistically compared using Kruskal–Wallis ANOVA. *p < 0.05, **p < 0.01, ***p < 0.001, ****p < 0.0001. PHENOTYPE:
|
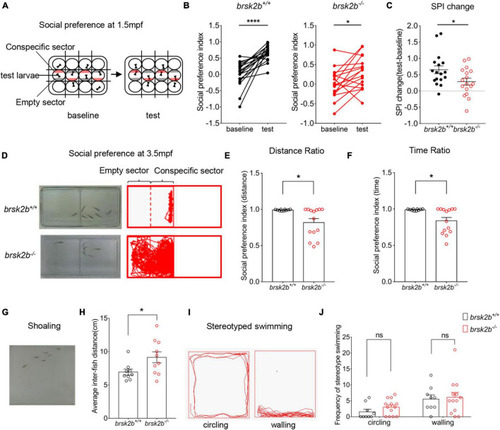
brsk2b mutant zebrafish displayed ASD-like behaviors. (A,D) The experimental paradigm of social preference test at 1.5 and 4 mpf. (B,C) The brsk2b–/– zebrafish displayed a significantly reduced preference for conspecifics compared to brsk2b+/+ zebrafish. And the change of social preference index (SPI) for brsk2b–/– zebrafish was significantly smaller than brsk2b+/+ fish (brsk2b+/+: brsk2b–/– = 17: 17, p = 0.029). Data for each genotype are presented as mean ± SEM and compared with Student’s t-tests. SPI changes are compared by a paired t-test. (E,F) The SPI of brsk2b–/– zebrafish at 4 mpf was significantly reduced compared to brsk2b+/+ fish both by distance (E) and time (F) ratio (brsk2b+/+: brsk2b–/– = 10: 14, p = 0.014 and 0.012, respectively). (G) The experimental paradigm of the shoaling test at 2.5 mpf. (H) The average inter-individual distance of brsk2b–/– zebrafish was smaller than that of brsk2b+/+ fish (brsk2b+/+: brsk2b–/– = 9: 10, p = 0.036). (I) The stereotyped swimming patterns in zebrafish are shown as “circling” and “walling.” (J) The brsk2b–/– zebrafish exhibited a trend of higher frequency of stereotyped behaviors though with no significant difference when compared to brsk2b+/+ fish (brsk2b+/+: brsk2b–/– = 9: 13, p = 0.206 and 0.980, respectively). Data for each genotype are presented as mean ± SEM and compared with Student’s t-tests. *p < 0.05, ****p < 0.0001. PHENOTYPE:
|
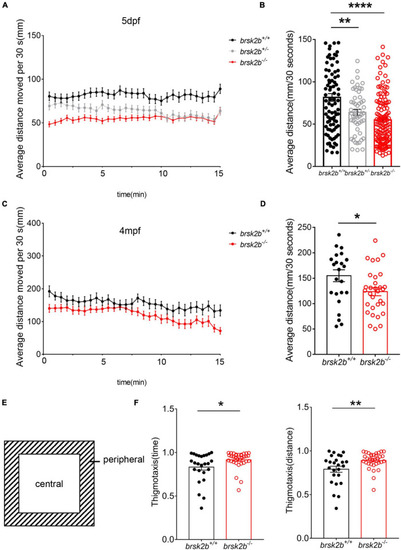
Locomotor analysis of brsk2b-deficient zebrafish showed impaired activity. (A,B) The activity of brsk2b–/– larvae was significantly reduced at 5 dpf compared to brsk2b+/+ larvae (brsk2b+/+: brsk2b±: brsk2b–/– = 89: 52: 128, p = 0.0001). (C,D) The activity of brsk2b–/– Adult zebrafish at 4 mpf also decreased than that of brsk2b+/+ fish (brsk2b+/+: brsk2b–/– = 24: 31, p = 0.024). (E) The tank was divided into two equal zones, the central zone and peripheral zone. The thigmotaxis was calculated by the time and distance ratio that fish spent in the peripheral zone. (F) The brsk2b–/– zebrafish tended to stay in the periphery that both the time and distance ratio of thigmotaxis were increased significantly (brsk2b+/+: brsk2b–/– = 25: 33, p = 0.023 and 0.007, respectively). Data are shown as mean ± SEM and compared by Student’s t-test for two genotypes and one-way ANOVA for three genotypes, *p < 0.05, **p < 0.01, ****p < 0.0001. |
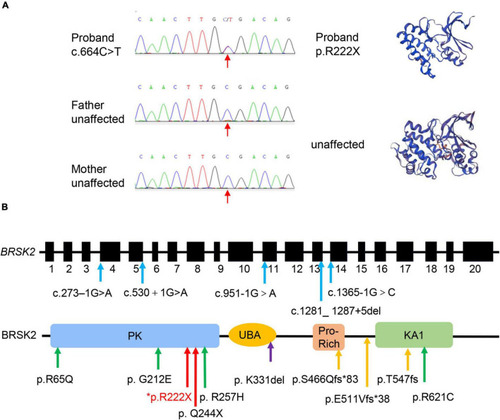
Genetic profile of BRSK2-deficient patients. (A) Sanger sequencing and computational modeling of BRSK2 in proband and unaffected parents. The red arrow indicates the mutation site. Proteins were modeled by SWISS-MODEL tool (https://swissmodel.expasy.org/). (B) Exon and domain structure and locations of observed variations in BRSK2. PK, protein kinase domain; UBA, ubiquitin-associated domain; Pro-Rich, proline-rich; KA1, kinase-associated domain. Blue arrow: splice site variation, green arrow: missense variation, yellow arrow: frameshift variation, red arrow: non-sense variation, purple arrow: microdeletion. * marks our proband. |
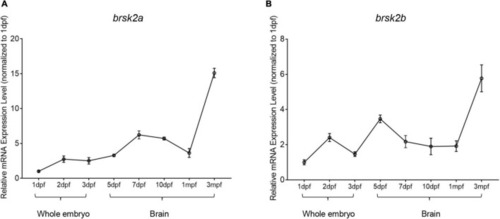
Temporal mRNA expression profiling of zebrafish brsk2. The mRNA expression levels of brsk2a (A), brsk2b (B) at 8 stages (Data are shown as mean ± SEM, n = 3 for each genotype). mRNA was extracted from whole embryos of 1 dpf, 2 dpf, 3 dpf, and brain tissues of 5 dpf, 7 dpf, 10 dpf, 1 mpf, and 3 mpf. |
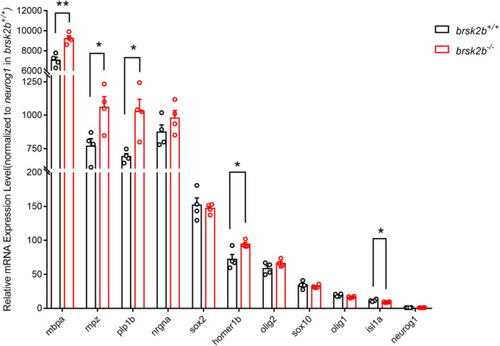
RT-qPCR showed altered expression levels of neurogenesis-related markers in brsk2b–/– zebrafish. Human homologous protein: HOMER1, Homer Scaffold Protein 1, a postsynaptic density scaffolding protein; NRGN, Neurogranin, a postsynaptic protein kinase substrate; ISL1, a DNA-binding transcriptional activator; SOX2, a transcription factor regulating embryonic development and determining cell fate; NEUROG1, a transcriptional regulator involved in the initiation of neuronal differentiation; OLIG1, Oligodendrocyte Transcription Factor 1, promotes formation and maturation of oligodendrocytes; OLIG2, Oligodendrocyte Transcription Factor 2, required for oligodendrocyte and motor neuron specification in the spinal cord; SOX10, a transcription factor that plays a central role in developing and mature glia; MBP, a major constituent of the myelin sheath of oligodendrocytes and Schwann cells in the nervous system; MPZ, a major structural protein of the peripheral myelin sheath; PLP, a major myelin protein in central nervous system. n = 4 for each genotype, data for each gene are shown as mean ± SEM and compared with multiple t-tests. *p < 0.05, **p < 0.01. |

ZFIN is incorporating published figure images and captions as part of an ongoing project. Figures from some publications have not yet been curated, or are not available for display because of copyright restrictions. PHENOTYPE:
|