
|
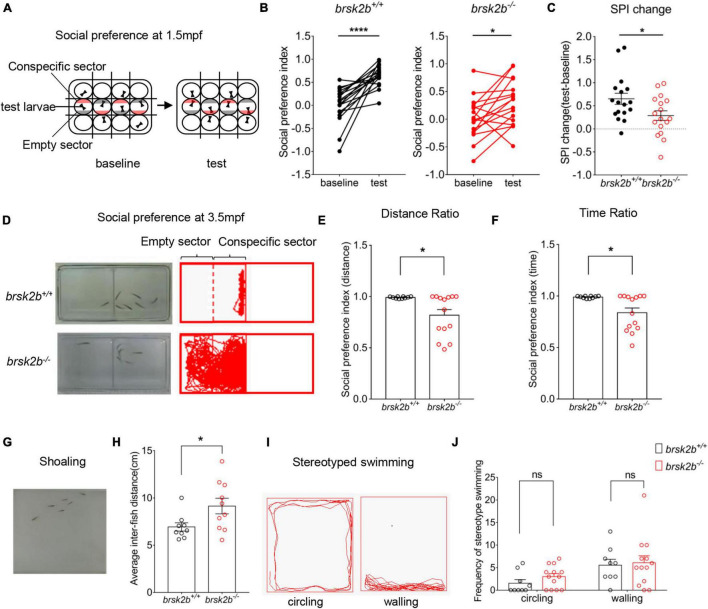
Fig. 5
brsk2b mutant zebrafish displayed ASD-like behaviors. (A,D) The experimental paradigm of social preference test at 1.5 and 4 mpf. (B,C) The brsk2b–/– zebrafish displayed a significantly reduced preference for conspecifics compared to brsk2b+/+ zebrafish. And the change of social preference index (SPI) for brsk2b–/– zebrafish was significantly smaller than brsk2b+/+ fish (brsk2b+/+: brsk2b–/– = 17: 17, p = 0.029). Data for each genotype are presented as mean ± SEM and compared with Student’s t-tests. SPI changes are compared by a paired t-test. (E,F) The SPI of brsk2b–/– zebrafish at 4 mpf was significantly reduced compared to brsk2b+/+ fish both by distance (E) and time (F) ratio (brsk2b+/+: brsk2b–/– = 10: 14, p = 0.014 and 0.012, respectively). (G) The experimental paradigm of the shoaling test at 2.5 mpf. (H) The average inter-individual distance of brsk2b–/– zebrafish was smaller than that of brsk2b+/+ fish (brsk2b+/+: brsk2b–/– = 9: 10, p = 0.036). (I) The stereotyped swimming patterns in zebrafish are shown as “circling” and “walling.” (J) The brsk2b–/– zebrafish exhibited a trend of higher frequency of stereotyped behaviors though with no significant difference when compared to brsk2b+/+ fish (brsk2b+/+: brsk2b–/– = 9: 13, p = 0.206 and 0.980, respectively). Data for each genotype are presented as mean ± SEM and compared with Student’s t-tests. *p < 0.05, ****p < 0.0001.