
- Title
-
A Structural Atlas of the Developing Zebrafish Telencephalon Based on Spatially-Restricted Transgene Expression
- Authors
- Turner, K.J., Hawkins, T.A., Henriques, P.M., Valdivia, L.E., Bianco, I.H., Wilson, S.W., Folgueira, M.
- Source
- Full text @ Front. Neuroanat.
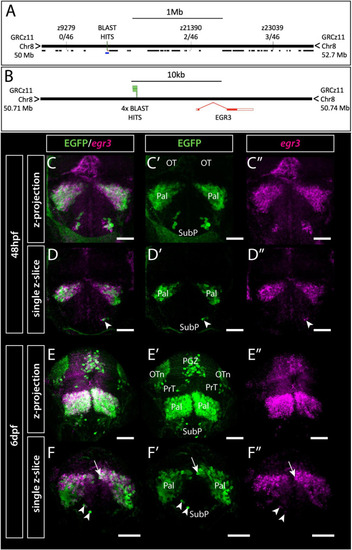
Et(gata2:EGFP)bi105 insertion is located near egr3 and expression of egr3 matches transgene expression. (A,B) Mapping of Et(gata2:EGFP)bi105 insertion showing the position of Genome Walker BLAST hits on assembly GRCz11, relative position of neighboring genes (black lines) and linkage markers with meiotic recombination data (A), the lower blue line in panel (A) indicates the region around egr3 shown in panel (B), with BLAST hits (insertion) locations. BLAST/BLAT coordinates: 8:50720195-50720677 (C–F″) Immunostaining and in situ hybridization showing EGFP and egr3 mRNA co-expression in the telencephalon and optic tectum of Et(gata2:EGFP)bi105 fish at 48 hpf (C–D″) and 6 dpf (E–F″) in frontal view. Panels (C–C″,E–E″) show z-projections and panels (D–D″,F–F″) show single z-slices. Note the co-expression of EGFP and egr3 in pallial (arrow) and subpallial (arrowheads) cells. Scale bars: 50 μm. |
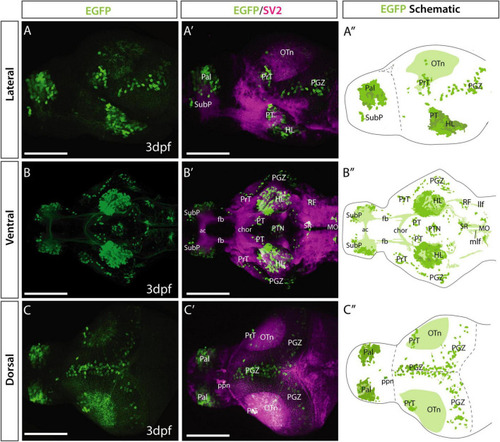
Et(gata2:EGFP)bi105 line EGFP expression at 3 dpf. Lateral (A,A′), ventral (B,B′) and dorsal (C,C′) views of a 4 dpf Et(gata2:EGFP)bi105 larvae labeled with anti-EGFP (green) and anti-SV2 antibodies (magenta). Major areas of EGFP expression are annotated in the schematics on the right (A″,B″,C″), these include: pallium, subpallial nucleus, pretectum, hypothalamic areas, optic tectum and hindbrain areas, among others. Scale bars: 100 μm. |
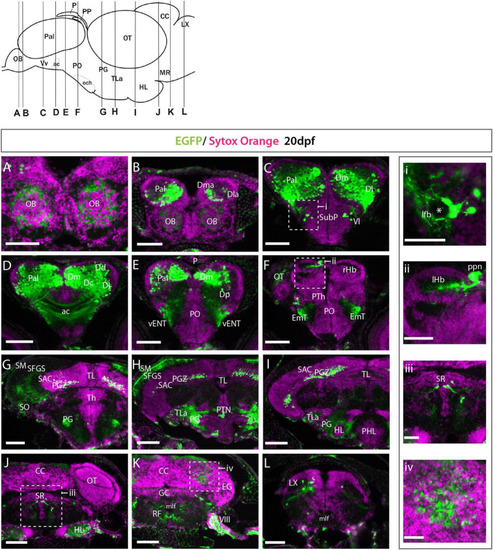
Et(gata2:EGFP)bi105 expression at 20 dpf. (A–L) Transverse section through an Et(gata2:EGFP)bi105 fish showing EGFP expression from rostral (A) to caudal areas (L). Schematic of lateral view of the brain (top left) shows levels of the sections. i-iv: detail of the areas marked in panels (C,F,J,K). Areas of EGFP expression at this stage was consistent with those seen at 3dpf; the only de novo expression observed was in the cerebellum and vagal lobe (K,L,iv). Asterisk labels the lateral forebrain bundle (lfb). Scale bars: (A–L) 100 μm; (i–iv) 40 μm. |
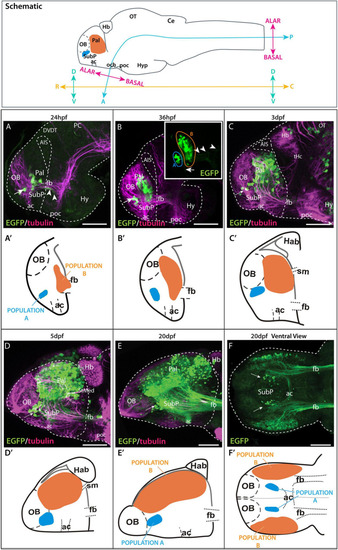
Time series showing Et(gata2:EGFP)bi105 expression. Top box: sagittal view of a 3dpf zebrafish larval brain illustrating the body axis coordinates (“rostral,” “caudal,” “dorsal,” and “ventral”) predominantly used in this paper (adapted from Herget et al., 2014). For reference, the bent neuraxis of the neural tube is also shown (see Herget et al., 2014) with the alar/basal subdivision of the brain defined according to the neuromeric model (Puelles and Rubenstein, 2003, 2015). Lateral (A–E) and ventral (F) views of zebrafish brains stained against EGFP only inset in (B,F) or EGFP in combination with acetylated tubulin (A–E) from 24 hpf to 20 dpf. Arrow points to the ventral EGFP+ population identified as a subpallial nucleus. Arrowheads in panels [(A,B) inset] point to processes exiting the telencephalon along the forebrain bundle toward caudal areas. Arrow in panel (B) inset points to processes extending to the dorsal part of the anterior commissure. (A′–F′) Schematics showing the changes in location of the EGFP+ populations A and B relative to telencephalic regions and tracts over time. Rostral to the left. Scale bars: (A–D) 50 μm; (E,F). Axis coordinates abbreviations: A, anterior; C, caudal; D, dorsal; P, posterior; R, rostral; V, ventral. 100 μm. |
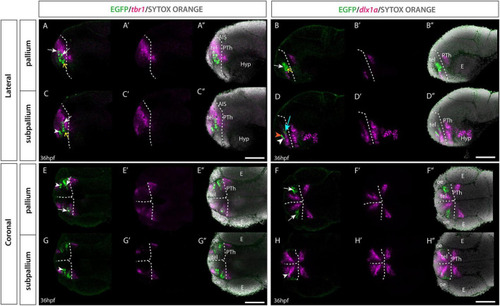
Et(gata2:EGFP)bi105 line expression in combination with tbr1 and dlx1a markers. Sagittal (A–D″) and horizontal (E–H″) sections through a 36hpf Et(gata2:EGFP)bi105 fish labeled with anti-GFP (green) and FISH for tbr1 (magenta) (A,A″,C,C″,E,E″,G,G″) or dlx1a (magenta) (B,B″,D,D″,F,F″,H,H″) with cell nuclei stained with sytox orange (gray). All images are single confocal z-slices taken from volumes, rostral to the left. White arrows indicate pallial EGFP+ cells that express tbr1 and do not express dlx1a. White arrowheads indicate subpallial EGFP+ cells that express dlx1a and do not express tbr1. Yellow arrows indicate EGFP+ cells located ventral in the pallial domain [population B] that do not express tbr1 or dlx1a. (D) Orange arrowhead shows a subpallial EGFP+ cell that does not express dlx1a. Cyan arrow shows a medial pallial cell that expresses dlx1a. Dotted white line indicates the telencephalic ventricle. Scale bars: 50 μm. |
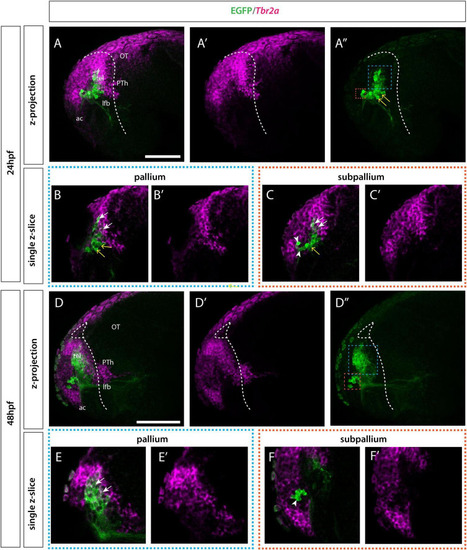
Et(gata2:EGFP)bi105 line expression in combination with tbr2a. Lateral view of Et(gata2:EGFP)bi105 fish labeled with anti-GFP (green) and FISH for tbr2a (magenta) at 24hpf (A–C′) and 48hpf (D–D″). Rostral to the left. Images are projections for z-stacks (A–A″,D–F′) or single-confocal z-slices (B,B′,C,C′,E,E′,F,F′). (A″,D″) Blue whisker box contains EGFP+ pallial cells; orange whisker box contains subpallial cells. (B,B′,E,E′) Sagittal section through pallial cells. (C,C′,F,F′) Sagittal section through subpallial cells. Arrows indicate pallial EGFP+ cells that express tbr2a. Arrowheads indicate subpallial EGFP+ cells that do not express tbr2a. Yellow arrows indicate EGFP+ cells in the ventral pallial domain (population B) that do not express tbr2a at 24hpf. By 48hpf the intermediate cells (yellow arrow) have resolved into the two distinct pallial/tbr2a+ and subpallial/tbr2a- populations. Dotted white line indicates the telencephalic ventricle. Scale bars: 50 μm. |
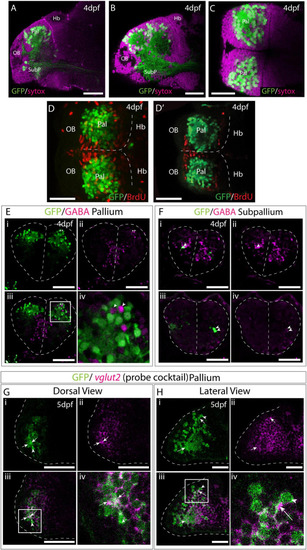
Et(gata2:EGFP)bi105 is expressed in post-mitotic glutamatergic pallial neurons. Sagittal (A,B) and horizontal (C) sections through a 4dpf Et(gata2:EGFP)bi105 brain stained with sytox (magenta) to label cell nuclei and anti-EGFP (green). EGFP expression is largely excluded from the dorsal and medial ventricular zones of the telencephalon. (D,D′) Dorsal views of a 4dpf Et(gata2:EGFP) bi105 brain labeled with anti-BrdU (red) and anti-GFP (green) antibodies. (D) z-projection and (D′) shows a single coronal z-slice through the same brain. BrdU is excluded from the EGFP+ neurons in the dorsal telencephalon indicating that these cells are likely to be non-proliferative and postmitotic. (E–F) Transverse sections through the telencephalon of a 4dpf Et(gata2:EGFP) bi105 brain stained with anti-GABA (magenta) to label GABAergic cells and anti-GFP (green). EGFP+ cells in the pallium (E) are for the most part GABA-. Gaps where GABAergic pallial interneurons intermingle with EGFP+ pallial neurons are visible [arrowheads in panel (Ei)]. In subpallial telencephalic domains (F) some cells do co-express EGFP and GABA [arrowheads in panels (Fi–iv)]. Panels (Fi–iv) are different z-sections through the same Et(gata2:EGFP) bi105 brain showing subpallial EGFP+ neurons on both sides of the brain. Dorsal (G) and lateral (H) views of Et(gata2:EGFP) bi105 brains at 5dpf labeled with FISH using a “cocktail” probe for vglut2a/slc17a6b and vglut2b/slc17a6a (magenta) and antibody labeling with anti-GFP (green) show overlap of vglut2a and EGFP within the telencephalic neuropil (arrows) associated with EGFP+ cells (arrowheads). (Giv) High-magnification view of dorsal telencephalic neurons in boxed region in panel (Giii). (Hiv) High-magnification view of dorsal telencephalic neurons in boxed region in panel (Hiii). Scale bars: 50 μm. |
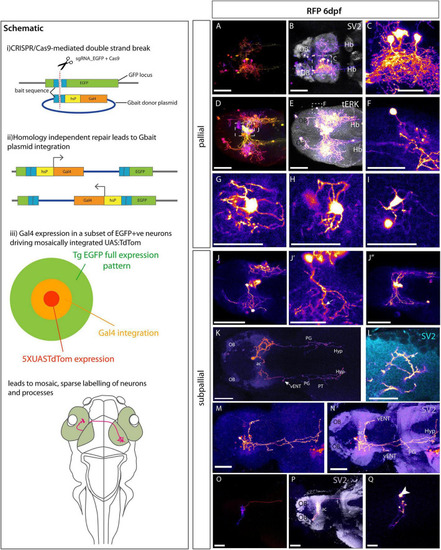
Morphologies of pallial and subpallial neurons. Schematic: Schematic parts (i,ii) adapted from |
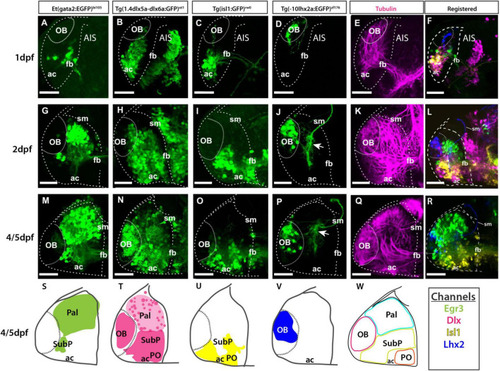
Atlas of transgene expression in the developing telencephalon: Lateral views. Et(gata2:EGFP)bi105 in comparison with Tg(1.4dlx5a-dlx6a:GFP)ot1, Tg(isl1:GFP)rw0, Tg(-10lhx2a:EGFP)zf176 and acetylated tubulin antibody staining. Lateral views of 1dpf, 2dpf and 4/5dpf fish stained against GFP (A–D,G–J,M–P) and acetylated tubulin (E,K,Q). Images are projections of confocal stacks. Rostral to the left. (N) 4dpf; (M,O–R) 5dpf. (S–W) Schematics showing the location of the GFP+ cells in the different transgenic lines. (W) Schematic showing all GFP+ domains. (F,L,R) Transgenic datasets registered to a single reference brain for each developmental stage, with the exception of 4dpf Tg(1.4dlx5a-dlx6a:GFP)ot1 which could not be registered to 5dpf data. Channels key below final column shows the color of each transgenic in the registered images and the schematics. Scale bars: 50 μm. |
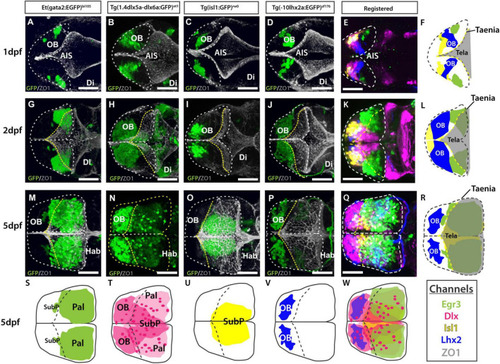
Atlas of transgene expression in the developing telencephalon. Dorsal views. Et(gata2:EGFP)bi105 in comparison with Tg(1.4dlx5a-dlx6a:GFP)ot1, Tg(isl1:GFP)rw0, Tg(-10lhx2a:EGFP)zf176. ZO1: ventricular zone and tela choroidea. Dorsal views of 1dpf, 2dpf and 5dpf fish stained against GFP and ZO1. Images are projections of confocal stacks. Rostral to the left. White dashed line in panels (A–R) marks the outline of the telencephalon. Yellow dashed marks in A-R the rostral attachments of the tela choroidea or taeniae. (F,L,R) Schematics showing the location of GFP+ cells in each transgenic line relative to the ZO1 positive tela choroidea (semi-opaque gray) over development, showing the expansion of the tela and rearrangement of telencephalic domains. The taenia is the point of attachment of the tela choroidea. (S–V) Schematics showing the location of the GFP+ cells in each transgenic dataset by 5dpf. Black dashed line marks the rostral attachments of the tela choroidea or taeniae. (E,K,Q) Transgenic datasets registered to a single reference brain for each developmental stage. (W) Schematic of all registered GFP+ expression. Channels key below final column shows the color of each transgenic within the composite images and schematics. Scale bars: 50 μm. |
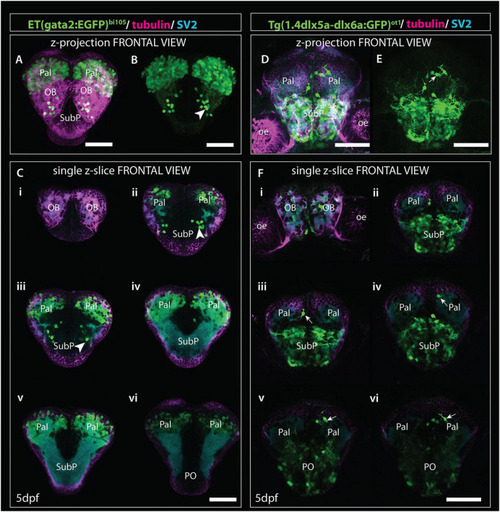
Comparison of gata2:EGFP and 1.4dlx5a-dlx6a:GFP expression in frontal view (z-projections and single z-slices). (A) Frontal view of the telencephalon of a 4dpf Et(gata2:EGFP)bi105 fish labeled with anti-EGFP (green), anti-tubulin (magenta) and anti-SV2 antibodies (cyan). (B) EGFP channel only. (Ci–vi) Single z-slices from rostral (i) to caudal levels (vi). Arrowheads in panel (B,Cii,iii) point to gata2:EGFP + subpallial neurons. (D,E) Frontal view of the telencephalon of a 4dpf Tg(1.4dlx5a-dlx6a:GFP)ot1 fish labeled with anti-EGFP (green), anti-tubulin (magenta) and anti-SV2 antibodies (cyan). (E) GFP channel only. (Fi–vi) Single z-slices from rostral (i) to caudal levels (vi). [Arrows in panels (E,Fiii,vi)] label 1.4dlx5a-dlx6a:GFP+ interneurons in the pallium. Panels (Ci–vi,Fi–vi) are equivalent rostrocaudal levels. Scale bars: 50 μm. |