
|
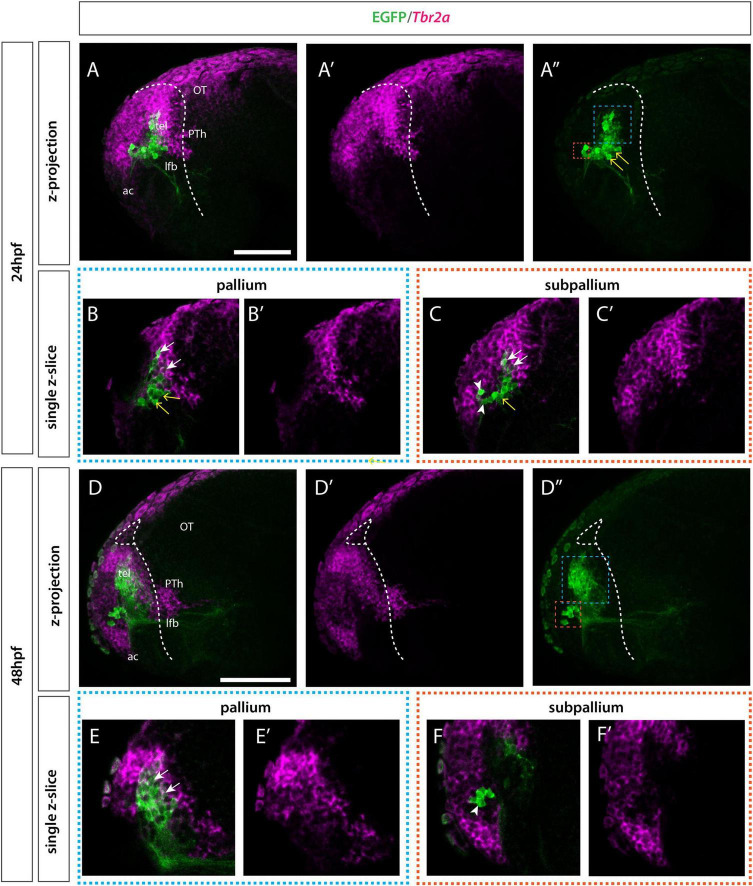
Fig. 6
Et(gata2:EGFP)bi105 line expression in combination with tbr2a. Lateral view of Et(gata2:EGFP)bi105 fish labeled with anti-GFP (green) and FISH for tbr2a (magenta) at 24hpf (A–C′) and 48hpf (D–D″). Rostral to the left. Images are projections for z-stacks (A–A″,D–F′) or single-confocal z-slices (B,B′,C,C′,E,E′,F,F′). (A″,D″) Blue whisker box contains EGFP+ pallial cells; orange whisker box contains subpallial cells. (B,B′,E,E′) Sagittal section through pallial cells. (C,C′,F,F′) Sagittal section through subpallial cells. Arrows indicate pallial EGFP+ cells that express tbr2a. Arrowheads indicate subpallial EGFP+ cells that do not express tbr2a. Yellow arrows indicate EGFP+ cells in the ventral pallial domain (population B) that do not express tbr2a at 24hpf. By 48hpf the intermediate cells (yellow arrow) have resolved into the two distinct pallial/tbr2a+ and subpallial/tbr2a- populations. Dotted white line indicates the telencephalic ventricle. Scale bars: 50 μm.