
Fig. 9
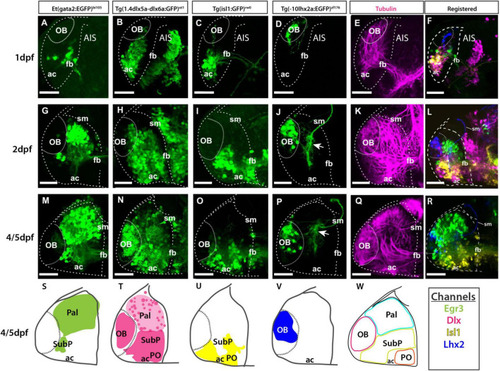
Atlas of transgene expression in the developing telencephalon: Lateral views. Et(gata2:EGFP)bi105 in comparison with Tg(1.4dlx5a-dlx6a:GFP)ot1, Tg(isl1:GFP)rw0, Tg(-10lhx2a:EGFP)zf176 and acetylated tubulin antibody staining. Lateral views of 1dpf, 2dpf and 4/5dpf fish stained against GFP (A–D,G–J,M–P) and acetylated tubulin (E,K,Q). Images are projections of confocal stacks. Rostral to the left. (N) 4dpf; (M,O–R) 5dpf. (S–W) Schematics showing the location of the GFP+ cells in the different transgenic lines. (W) Schematic showing all GFP+ domains. (F,L,R) Transgenic datasets registered to a single reference brain for each developmental stage, with the exception of 4dpf Tg(1.4dlx5a-dlx6a:GFP)ot1 which could not be registered to 5dpf data. Channels key below final column shows the color of each transgenic in the registered images and the schematics. Scale bars: 50 μm. |