
Fig. 4
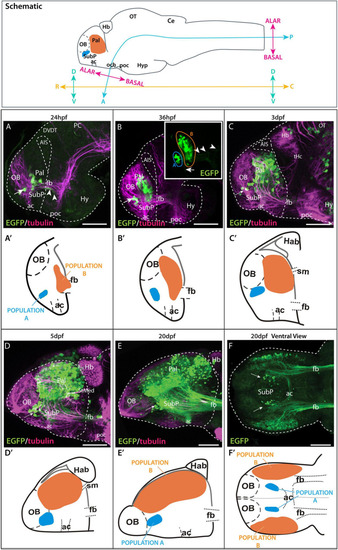
Time series showing Et(gata2:EGFP)bi105 expression. Top box: sagittal view of a 3dpf zebrafish larval brain illustrating the body axis coordinates (“rostral,” “caudal,” “dorsal,” and “ventral”) predominantly used in this paper (adapted from Herget et al., 2014). For reference, the bent neuraxis of the neural tube is also shown (see Herget et al., 2014) with the alar/basal subdivision of the brain defined according to the neuromeric model (Puelles and Rubenstein, 2003, 2015). Lateral (A–E) and ventral (F) views of zebrafish brains stained against EGFP only inset in (B,F) or EGFP in combination with acetylated tubulin (A–E) from 24 hpf to 20 dpf. Arrow points to the ventral EGFP+ population identified as a subpallial nucleus. Arrowheads in panels [(A,B) inset] point to processes exiting the telencephalon along the forebrain bundle toward caudal areas. Arrow in panel (B) inset points to processes extending to the dorsal part of the anterior commissure. (A′–F′) Schematics showing the changes in location of the EGFP+ populations A and B relative to telencephalic regions and tracts over time. Rostral to the left. Scale bars: (A–D) 50 μm; (E,F). Axis coordinates abbreviations: A, anterior; C, caudal; D, dorsal; P, posterior; R, rostral; V, ventral. 100 μm. |