
Fig. 10
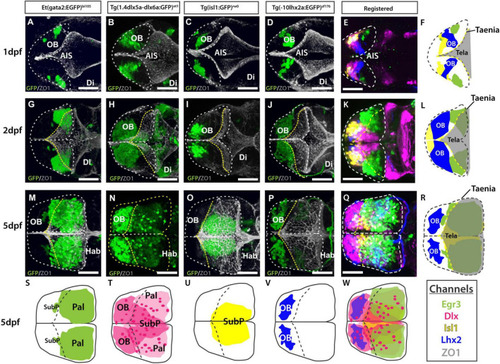
Atlas of transgene expression in the developing telencephalon. Dorsal views. Et(gata2:EGFP)bi105 in comparison with Tg(1.4dlx5a-dlx6a:GFP)ot1, Tg(isl1:GFP)rw0, Tg(-10lhx2a:EGFP)zf176. ZO1: ventricular zone and tela choroidea. Dorsal views of 1dpf, 2dpf and 5dpf fish stained against GFP and ZO1. Images are projections of confocal stacks. Rostral to the left. White dashed line in panels (A–R) marks the outline of the telencephalon. Yellow dashed marks in A-R the rostral attachments of the tela choroidea or taeniae. (F,L,R) Schematics showing the location of GFP+ cells in each transgenic line relative to the ZO1 positive tela choroidea (semi-opaque gray) over development, showing the expansion of the tela and rearrangement of telencephalic domains. The taenia is the point of attachment of the tela choroidea. (S–V) Schematics showing the location of the GFP+ cells in each transgenic dataset by 5dpf. Black dashed line marks the rostral attachments of the tela choroidea or taeniae. (E,K,Q) Transgenic datasets registered to a single reference brain for each developmental stage. (W) Schematic of all registered GFP+ expression. Channels key below final column shows the color of each transgenic within the composite images and schematics. Scale bars: 50 μm. |