
Fig. 11
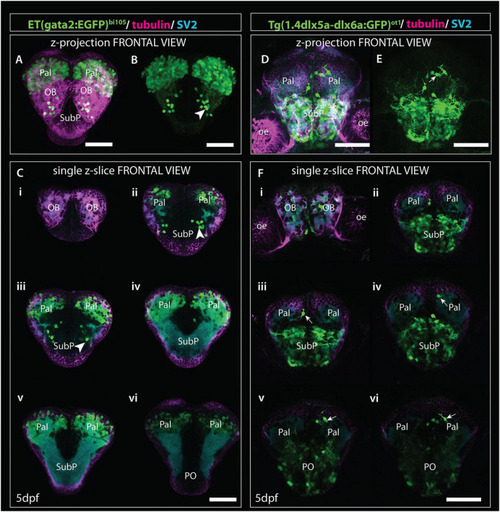
Comparison of gata2:EGFP and 1.4dlx5a-dlx6a:GFP expression in frontal view (z-projections and single z-slices). (A) Frontal view of the telencephalon of a 4dpf Et(gata2:EGFP)bi105 fish labeled with anti-EGFP (green), anti-tubulin (magenta) and anti-SV2 antibodies (cyan). (B) EGFP channel only. (Ci–vi) Single z-slices from rostral (i) to caudal levels (vi). Arrowheads in panel (B,Cii,iii) point to gata2:EGFP + subpallial neurons. (D,E) Frontal view of the telencephalon of a 4dpf Tg(1.4dlx5a-dlx6a:GFP)ot1 fish labeled with anti-EGFP (green), anti-tubulin (magenta) and anti-SV2 antibodies (cyan). (E) GFP channel only. (Fi–vi) Single z-slices from rostral (i) to caudal levels (vi). [Arrows in panels (E,Fiii,vi)] label 1.4dlx5a-dlx6a:GFP+ interneurons in the pallium. Panels (Ci–vi,Fi–vi) are equivalent rostrocaudal levels. Scale bars: 50 μm. |