
FIGURE
Fig. 3
Fig. 3
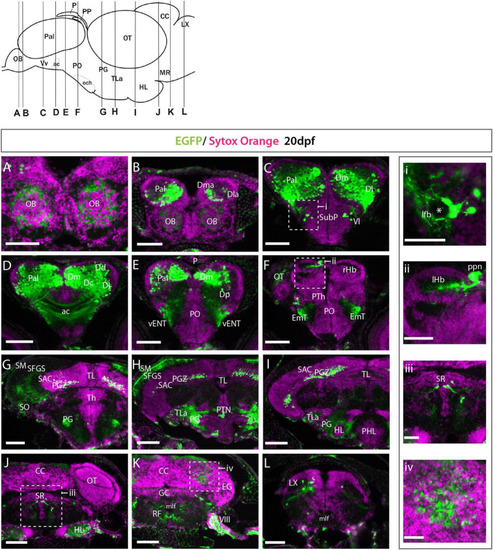
Et(gata2:EGFP)bi105 expression at 20 dpf. (A–L) Transverse section through an Et(gata2:EGFP)bi105 fish showing EGFP expression from rostral (A) to caudal areas (L). Schematic of lateral view of the brain (top left) shows levels of the sections. i-iv: detail of the areas marked in panels (C,F,J,K). Areas of EGFP expression at this stage was consistent with those seen at 3dpf; the only de novo expression observed was in the cerebellum and vagal lobe (K,L,iv). Asterisk labels the lateral forebrain bundle (lfb). Scale bars: (A–L) 100 μm; (i–iv) 40 μm. |
Expression Data
Expression Detail
Antibody Labeling
Phenotype Data
Phenotype Detail
Acknowledgments
This image is the copyrighted work of the attributed author or publisher, and
ZFIN has permission only to display this image to its users.
Additional permissions should be obtained from the applicable author or publisher of the image.
Full text @ Front. Neuroanat.