
- Title
-
Interleukin-11 signaling promotes cellular reprogramming and limits fibrotic scarring during tissue regeneration
- Authors
- Allanki, S., Strilic, B., Scheinberger, L., Onderwater, Y.L., Marks, A., Günther, S., Preussner, J., Kikhi, K., Looso, M., Stainier, D.Y.R., Reischauer, S.
- Source
- Full text @ Sci Adv
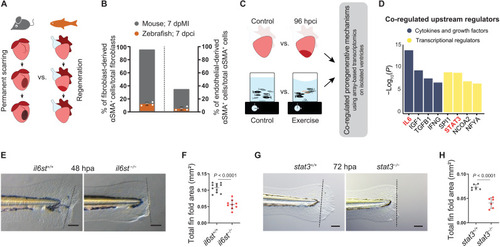
Il-6 cytokine family–mediated Stat3 signaling is proregenerative. (A) Illustration of scarring in an adult mammalian heart in contrast to regeneration in an adult zebrafish heart. (B) Quantification of epicardial- and endothelial-derived αSMA+ cells after MI in mouse [fibroblasts ( |
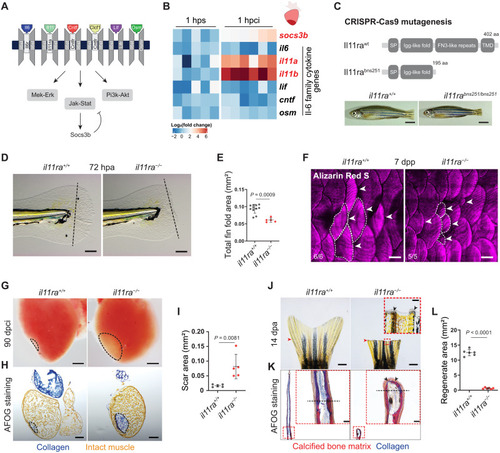
Il-11 signaling is essential for scar-free regeneration. (A) Illustration of zebrafish Il-6 family cytokines and receptors and the downstream signaling pathways. (B) Heatmap showing RT-qPCR analysis of Il-6 family cytokine gene mRNA levels at 1 hpci (n = 6) compared with 1 hour post sham (hps; n = 5). (C) Illustration of wild-type and predicted mutant proteins and gross morphology of adult zebrafish siblings. (D and E) Bright-field images of larval fin fold regeneration (D) (wt siblings, n = 11; mut, n = 5; 72 hpa) and their corresponding quantification of the total fin fold area (E). (F) Wholemount images of Alizarin Red S stained regenerating adult scales [wt siblings, n = 6; mut, n = 5; 7 days post plucking (dpp)]. (G to I) Wholemount images of cardiac ventricles (G) (wt siblings, n = 5; mut, n = 5; 90 dpci), Acid Fuchsin Orange G (AFOG) staining on cryosections (H), and quantification of the scar area (I). (J to L) Wholemount images of caudal fins (J) [wt, n = 6; mut, n = 6, 14 days post amputation (dpa)], AFOG staining on longitudinal cryosections (K), and quantification of the regenerate area (L). SP, signal peptide; TMD, transmembrane domain; aa, amino acids (C). Data represent means ± SD (E, I, and L). Student’s t tests (E, I, and L). n, ventricles (B and G); n, larvae (D); n, adult zebrafish (F); n, caudal fins (J). Black dashed lines demarcate the injured area (G and H) and amputation plane (D and K); white dashed lines demarcate and white arrowheads point to regenerating scales (F); black arrowheads point to fused hemirays [insets in (J) and (K)]; red arrowheads point to the amputation plane (J). Ct values are listed in table S5. Scale bars, 5 mm (C), 100 μm (D), 500 μm (F), 200 μm (G and H), 1 mm (J), and 50 μm (K). |
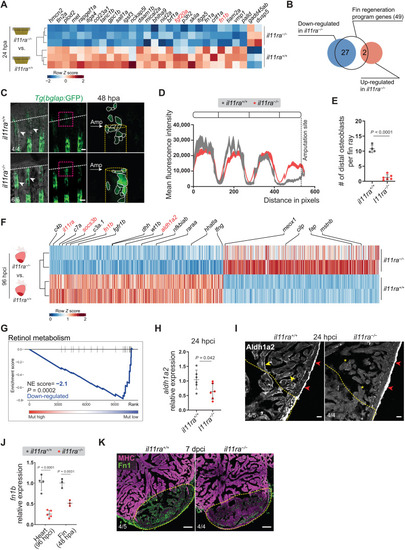
Il-11 signaling is required for the activation of global and tissue-specific regeneration gene programs. (A and B) Differential expression of fin regeneration genes ( |

Il-11 signaling is required for CM repopulation after cardiac injury. (A and B) Costaining for MEF2 (magenta) and PCNA (green) expression to determine CM mitotic index on cryosections from ventricles (A) (wt siblings, n = 7; mut, n = 6; 7 dpci) and quantification within the 100-μm wound border zone for 7 and 14 dpci (B). (C to E) F-actin staining on 50-μm-thick cryosections from il11ra−/− versus wild-type ventricles, 7 dpci (C), and quantification of the number per ventricle (D) (wt siblings, n = 11; mut, n = 9) and length (E) (wt, n = 540; mut, n = 281) of CM protrusions. (F and G) Wholemount fluorescence images of Tg(gata4:EGFP) expression in ventricles (F) (wt siblings, n = 4; mut, n = 5; 14 dpci) and quantification of cortical CM wound coverage on the corresponding cryosections in fig. S8F (G). Data represent means ± SD (B, D, E, and G). Student’s t tests (B, D, and G); Mann-Whitney U test (E). n, ventricles (A, D, and F); n, CM protrusions (E). White dashed lines demarcate 100-μm injury border zone (A); yellow dashed lines demarcate the injured area (C and F). Scale bars, 50 μm (A and C) and 100 μm (F). |
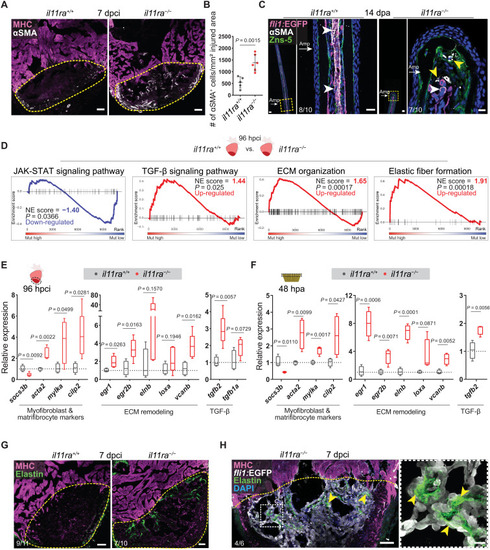
Il-11 signaling limits myofibroblast differentiation and profibrotic ECM remodeling after injury. (A) Immunostaining for αSMA (white) and MHC (magenta) expression on cryosections from cardiac ventricles (wt siblings, n = 5; mut, n = 6; 7 dpci). (B) Quantification of αSMA+ cell density. (C) Immunostaining for αSMA (white), GFP (magenta), and Zns-5 antigen (scleroblasts, green) expression on longitudinal cryosections from EXPRESSION / LABELING:
PHENOTYPE:
|
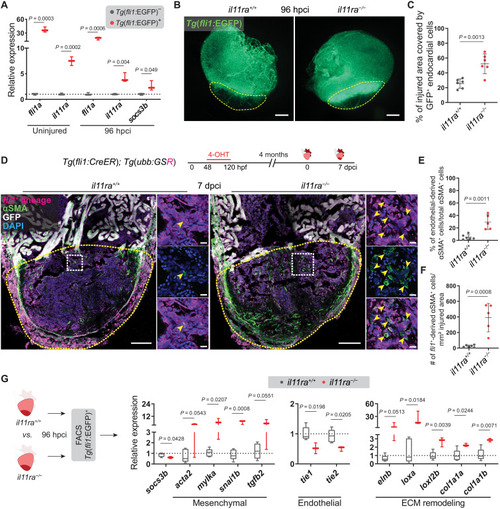
Il-11 signaling antagonizes EndoMT after cardiac injury. (A) RT-qPCR analysis on sorted Tg(fli1:EGFP)+ versus Tg(fli1:EGFP)− cardiac ventricular cells (uninjured siblings, n = 3; 96 hpci, n = 3). (B and C) Wholemount fluorescence images of (B) (wt siblings, n = 6; mut, n = 6; 96 hpci) Tg(fli1:EGFP) expression in ventricles and quantification of percentage of injured area covered by GFP+ endocardial cells (C). (D) Experimental design and confocal images of immunostaining (mCherry, magenta; αSMA, green) on cryosections from (wt siblings, n = 6; mut, n = 5; 7 dpci) Tg(fli1:CreER); Tg(ubb:GSR) ventricles. (E and F) Quantification of percentage (E) and density (F) of fli1+-derived αSMA+ cells in the injured area, 7 dpci. (G) Schematic and RT-qPCR analysis on sorted Tg(fli1:EGFP)+ cells from (wt siblings, n = 5; mut, n = 3; 96 hpci) ventricles for EndoMT-associated gene mRNA levels. Data represent means ± SD (C, E, and F), and box plots (A and G) show median, IQR (box margins), and 5th and 95th percentiles (whiskers). Student’s t tests (A, C, and E to G). n, pools of two ventricles (A and G), n, ventricles (B to F). Yellow dashed lines demarcate the injured area (B and D); yellow arrowheads point to fli1+-derived αSMA+ cells (D, insets). Ct values are listed in table S5. Scale bars, 200 μm (B), 100 μm (D), and 10 μm (D, insets).
|
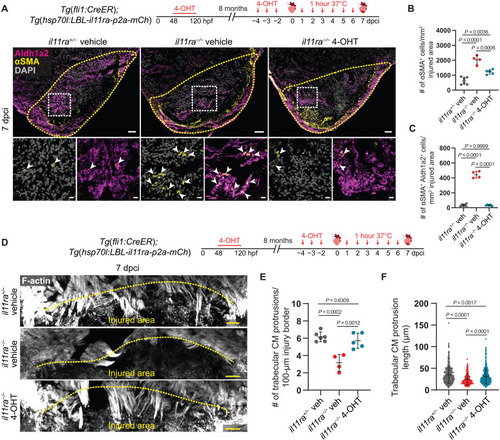
Il-11 signaling in endothelial cells allows CM repopulation after cardiac injury. (A) Experimental design and confocal images of immunostaining (Aldh1a2, magenta; αSMA, yellow) on cryosections from vehicle-treated il11ra+/− siblings (n = 6) and vehicle- or 4-OHT–treated il11ra−/− (n = 4 and 5, respectively) Tg(fli1:CreER); Tg(hsp70l:LBL-il11ra-p2a-mCh) ventricles at 7 dpci. (B and C) Quantification of total αSMA+ cell density (B) and αSMA+ Aldh1a2+ cell density (C) in the injured area, 7 dpci. (D) Experimental design and F-actin staining on 50-μm-thick cryosections from vehicle-treated il11ra+/− siblings and vehicle- or 4-OHT–treated il11ra−/− Tg(fli1:CreER); Tg(hsp70l:LBL-il11ra-p2a-mCh) ventricles at 7 dpci. (E and F) Quantification of the number per ventricle (E) (il11ra+/− veh, n = 6; il11ra−/− veh, n = 4; il11ra−/− 4-OHT, n = 5) and length (F) (il11ra+/− veh, n = 481; il11ra−/− veh, n = 185; il11ra−/− 4-OHT, n = 437) of CM protrusions at 7 dpci. Data represent means ± SD (B, C, E, and F). One-way ANOVA (B, C, and E); Kruskal-Wallis test (F). n, ventricles (A and E); n, CM protrusions (F). Yellow dashed lines demarcate the injured area (A and D); white arrowheads point to αSMA+ Aldh1a2+ endocardial cells (A, insets). Scale bars, 50 μm (A and D) and 10 μm (A, insets).
|
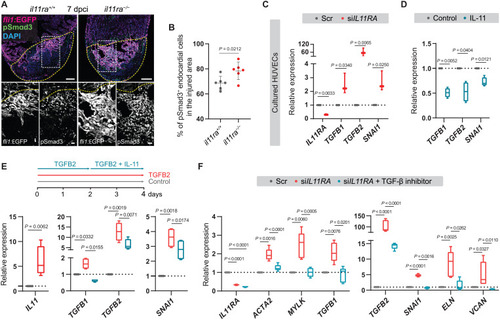
IL-11 signaling feeds back to inhibit TGF-β–mediated scarring. (A and B) Confocal images of immunostaining (A) (GFP, magenta; pSmad3, green; 7 dpci) on cryosections from il11ra−/− versus wild-type Tg(fli1:EGFP) ventricles and quantification of percentage of pSmad3+ endocardial cells in the injured area (B) (wt siblings, n = 6; mut, n = 6). (C) RT-qPCR analysis for IL11RA, genes encoding TGF-β ligands, and TGF-β downstream target SNAI1 mRNA levels on HUVECs transfected with scrambled (n = 3) or IL11RA siRNAs (n = 3). (D) RT-qPCR analysis for genes encoding TGF-β ligands and for TGF-β downstream target SNAI1 mRNA levels on HUVECs treated with control (n = 4) or rhIL-11 (10 ng/ml; n = 4). (E) Experimental design and RT-qPCR analysis for IL11, genes encoding TGF-β ligands, and for TGF-β downstream target SNAI1 mRNA levels on HUVECs treated with control (n = 4) or rhTGFB2 (10 ng/ml; n = 4) or rhTGFB2 + rhIL-11 (10 ng/ml) (n = 4). (F) RT-qPCR analysis for genes encoding myofibroblast markers, TGF-β ligands, TGF-β downstream target SNAI1, and for fibrogenic ECM component mRNA levels on HUVECs transfected with scrambled (n = 4) or siIL11RA (n = 4) or siIL11RA + 10 μM TGFBR1 inhibitor (SB431542; n = 4). Data represent means ± SD (B); box plots (C to F) show median, IQR (box margins), and 5th and 95th percentiles (whiskers). Student’s t tests [(B) to (D) and (E) IL11]; one-way ANOVA (E and F). n, ventricles (B); n, biological replicates (C to F). Yellow dashed lines demarcate the injured area (A). Ct values are listed in table S5. Scale bars, 100 μm (A) and 20 μm (A, insets). |