
FIGURE
Fig. 6.
- ID
- ZDB-FIG-220304-7
- Publication
- Allanki et al., 2021 - Interleukin-11 signaling promotes cellular reprogramming and limits fibrotic scarring during tissue regeneration
- Other Figures
- All Figure Page
- Back to All Figure Page
Fig. 6.
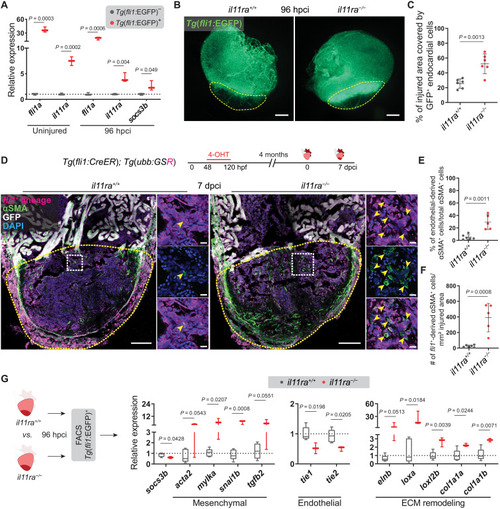
Il-11 signaling antagonizes EndoMT after cardiac injury. (A) RT-qPCR analysis on sorted Tg(fli1:EGFP)+ versus Tg(fli1:EGFP)− cardiac ventricular cells (uninjured siblings, n = 3; 96 hpci, n = 3). (B and C) Wholemount fluorescence images of (B) (wt siblings, n = 6; mut, n = 6; 96 hpci) Tg(fli1:EGFP) expression in ventricles and quantification of percentage of injured area covered by GFP+ endocardial cells (C). (D) Experimental design and confocal images of immunostaining (mCherry, magenta; αSMA, green) on cryosections from (wt siblings, n = 6; mut, n = 5; 7 dpci) Tg(fli1:CreER); Tg(ubb:GSR) ventricles. (E and F) Quantification of percentage (E) and density (F) of fli1+-derived αSMA+ cells in the injured area, 7 dpci. (G) Schematic and RT-qPCR analysis on sorted Tg(fli1:EGFP)+ cells from (wt siblings, n = 5; mut, n = 3; 96 hpci) ventricles for EndoMT-associated gene mRNA levels. Data represent means ± SD (C, E, and F), and box plots (A and G) show median, IQR (box margins), and 5th and 95th percentiles (whiskers). Student’s t tests (A, C, and E to G). n, pools of two ventricles (A and G), n, ventricles (B to F). Yellow dashed lines demarcate the injured area (B and D); yellow arrowheads point to fli1+-derived αSMA+ cells (D, insets). Ct values are listed in table S5. Scale bars, 200 μm (B), 100 μm (D), and 10 μm (D, insets).
|
Expression Data
| Genes: | |
|---|---|
| Fish: | |
| Condition: | |
| Anatomical Terms: | |
| Stage: | Adult |
Expression Detail
Antibody Labeling
Phenotype Data
| Fish: | |
|---|---|
| Conditions: | |
| Observed In: | |
| Stage: | Adult |
Phenotype Detail
Acknowledgments
This image is the copyrighted work of the attributed author or publisher, and
ZFIN has permission only to display this image to its users.
Additional permissions should be obtained from the applicable author or publisher of the image.
Full text @ Sci Adv