|
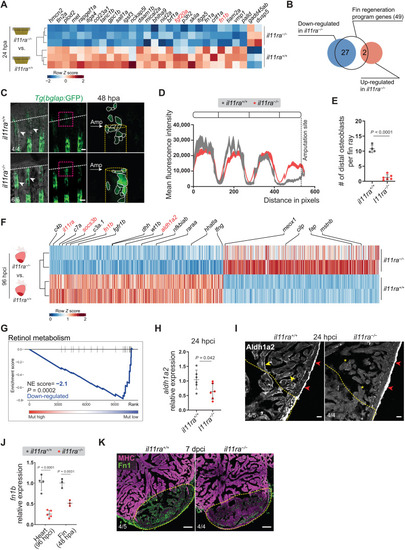
Il-11 signaling is required for the activation of global and tissue-specific regeneration gene programs. (A and B) Differential expression of fin regeneration genes (13) in il11ra−/− versus wild-type sibling caudal fin transcriptomic analysis, 24 hpa. (C to E) Confocal images of Tg(bglap:GFP) expression in wholemount caudal fins (C) (wt siblings, n = 4; mut, n = 6; 48 hpa), quantification of Tg(bglap:GFP) fluorescence intensity (D), and the number of distal osteoblasts (E). (F) Differential expression of known regulators of zebrafish cardiac regeneration (35) in il11ra−/− versus wild-type sibling ventricle transcriptomic analysis, 96 hpci. (G) GSE analysis plot of KEGG Retinol metabolism from il11ra−/− versus wild-type sibling ventricle transcriptomic analysis, 96 hpci. NE score, normalized enrichment score. (H and I) RT-qPCR analysis of aldh1a2 mRNA levels (H) (wt siblings, n = 6; mut, n = 6; 24 hpci) and immunostaining for Aldh1a2 expression on cardiac ventricle cryosections (I) (wt siblings, n = 5; mut, n = 4; 24 hpci). (J and K) RT-qPCR analysis of fn1b mRNA levels on dissected injured areas from cardiac ventricles (J) (wt siblings, n = 4; mut, n = 5; 96 hpci) and caudal fins (J) (wt siblings, n = 3; mut, n = 3; 48 hpa) and immunostaining on cryosections (K) (wt siblings, n = 5; mut, n = 4; 7 dpci) for Fibronectin1 (green) and myosin heavy chain (MHC; magenta) expression. Data represent means ± SD (E, H, and J); means ± SEM (D). Student’s t tests (E, H, and J). n, ventricles [(H), (I), (J) heart, and (K)]; n, caudal fins [(C) and (J) fin]. White arrows point to and white dashed lines demarcate the amputation plane (C); white arrowheads point to Tg(bglap:GFP) expression (C); yellow dashed lines demarcate the injured area (I and K) and bone rays (C); yellow arrowheads and asterisks indicate endocardial Aldh1a2 expression (I); red arrowheads point to epicardial Aldh1a2 expression (I). Ct values are listed in table S5. Scale bars, 100 μm (C and K) and 20 μm (I).
|