
|
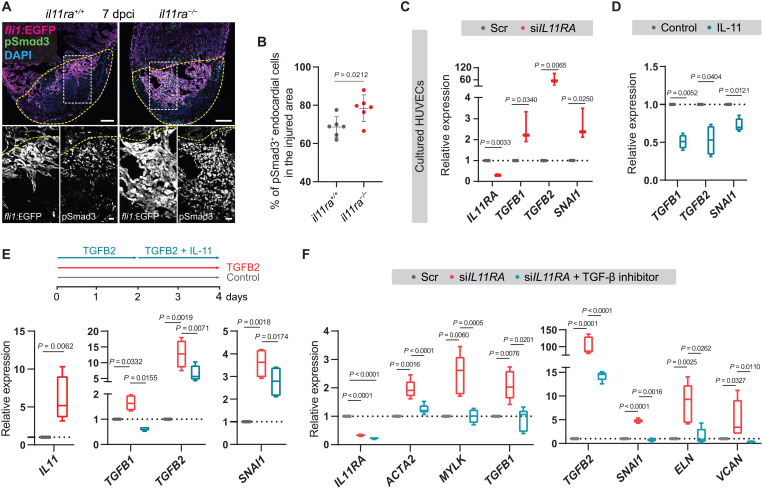
Fig. 8. IL-11 signaling feeds back to inhibit TGF-β–mediated scarring.
(A and B) Confocal images of immunostaining (A) (GFP, magenta; pSmad3, green; 7 dpci) on cryosections from il11ra−/− versus wild-type Tg(fli1:EGFP) ventricles and quantification of percentage of pSmad3+ endocardial cells in the injured area (B) (wt siblings, n = 6; mut, n = 6). (C) RT-qPCR analysis for IL11RA, genes encoding TGF-β ligands, and TGF-β downstream target SNAI1 mRNA levels on HUVECs transfected with scrambled (n = 3) or IL11RA siRNAs (n = 3). (D) RT-qPCR analysis for genes encoding TGF-β ligands and for TGF-β downstream target SNAI1 mRNA levels on HUVECs treated with control (n = 4) or rhIL-11 (10 ng/ml; n = 4). (E) Experimental design and RT-qPCR analysis for IL11, genes encoding TGF-β ligands, and for TGF-β downstream target SNAI1 mRNA levels on HUVECs treated with control (n = 4) or rhTGFB2 (10 ng/ml; n = 4) or rhTGFB2 + rhIL-11 (10 ng/ml) (n = 4). (F) RT-qPCR analysis for genes encoding myofibroblast markers, TGF-β ligands, TGF-β downstream target SNAI1, and for fibrogenic ECM component mRNA levels on HUVECs transfected with scrambled (n = 4) or siIL11RA (n = 4) or siIL11RA + 10 μM TGFBR1 inhibitor (SB431542; n = 4). Data represent means ± SD (B); box plots (C to F) show median, IQR (box margins), and 5th and 95th percentiles (whiskers). Student’s t tests [(B) to (D) and (E) IL11]; one-way ANOVA (E and F). n, ventricles (B); n, biological replicates (C to F). Yellow dashed lines demarcate the injured area (A). Ct values are listed in table S5. Scale bars, 100 μm (A) and 20 μm (A, insets).