
- Title
-
Tfap2b specifies an embryonic melanocyte stem cell that retains adult multifate potential
- Authors
- Brombin, A., Simpson, D.J., Travnickova, J., Brunsdon, H., Zeng, Z., Lu, Y., Young, A.I.J., Chandra, T., Patton, E.E.
- Source
- Full text @ Cell Rep.
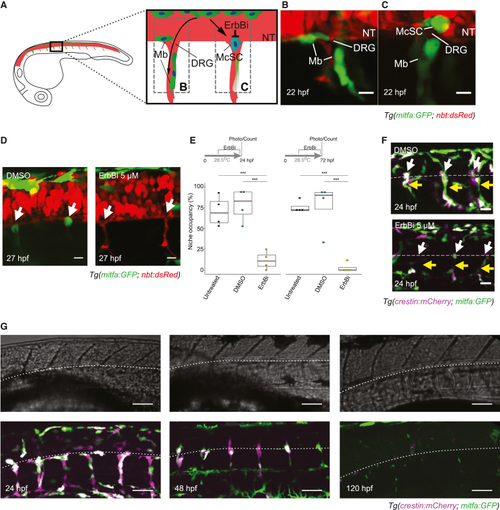
McSCs maintain an NC identity at the niche (A–C) Schematic of developing McSCs and melanocytes in the zebrafish embryo. mitfa-expressing melanoblasts (Mbs; green) develop directly from the NC and travel to the skin dorsolaterally (data not shown) or ventrally along the neural tube (NT) and peripheral nerves (red; B). A subset of those cells establishes at the site of the of the perspective dorsal root ganglia (DRGs) and become McSCs (blue; C). McSC establishment is sensitive to ErbB-kinase inhibitors (ErbBi). (B and C) Melanoblasts migrating along the axons (B) and a newly established McSC at the site of a perspective DRG (C). Shown are confocal stacks (20 μm) of Tg(mitfa:GFP; nbt:dsRed) embryos imaged laterally at 22 hpf. Scale bars, 20 μm. (D) ErbB kinase activity is required for McSC establishment at the niche (white arrow). Shown are confocal stacks (20 μm) of Tg(mitfa:GFP; nbt:dsRed) embryos treated with DMSO or ErbBi. Standard deviation (STD) projection. Scale bars, 20 μm. (E) Quantification of McSC niche occupancy. Tukey honestly significant difference (HSD) test; ∗∗∗p < 0.0001 (3 replicates, 5 embryos/condition/replicates). Lines in boxes indicate the medians, and whiskers indicate data within 1.5 interquartile range of the upper and lower quartiles. (F) McSCs maintain NC identity at the niche. Shown are confocal stacks (30 μm) of Tg(crestin:mCherry; mitfa:GFP) embryos treated with DMSO or ErbBi. McSCs (white arrows) and nerve-associated cells (yellow arrows) are dependent on ErbB kinase. STD projection. Scale bars, 20 μm. (G) McSCs and nerve-associated precursors express mitfa:GFP and crestin:mCherry, but expression is lost by 120 hpf. Shown are confocal stacks (30 μm) of Tg(crestin:mCherry; mitfa:GFP) embryos. The lower edge of the NT is indicated (white dotted line) on fluorescence and corresponding bright-field images (top). Bright-field, average intensity (AVG) projection; fluorescence, STD projection. Scale bars, 50 μm. |
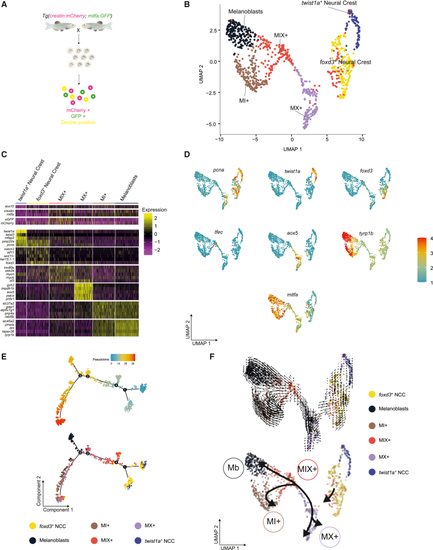
scRNA-seq identifies six distinct NC pigment cell lineage populations (A) Schematic of the experimental protocol. GFP+ and/or mCherry+ cells were isolated from Tg(crestin:mCherry; mitfa:GFP) embryos at 24 hpf. (B) UMAP of GFP+, mCherry+, and double-positive cells (n = 996 cells) obtained after Louvain clustering (dimensions, dims = 20, resolution = 0.5). (C) Heatmap showing the average log2 fold change expression of five selected genes per cluster identified in (B). The average log2 fold change expression across the 6 clusters of sox10, crestin, mitfa, mCherry, and GFP expression levels are also presented for comparison. (D) UMAP representations of (B) with color change from blue (negative) to red (positive) based on log2 mRNA expression of pcna, twist1a, foxd3, aox5, tfec, mitfa, and tyrp1b. (E) Pseudotime ordering of the cells in (B). Top: pseudocoloring based on pseudotime scores. Bottom: pseudocoloring based on cluster identity. (F) RNA velocity analysis of the UMAP represented in (B) (top) and simplified representation (bottom). See also Figures S1–S3 and Tables S1 and S2. |
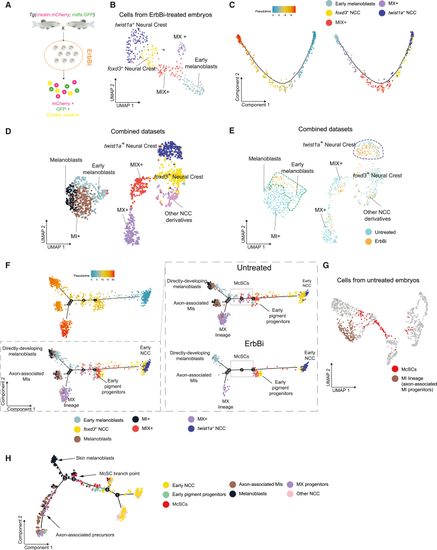
Identification of ErbB-dependent McSCs by scRNA-seq (A) Schematic of the scRNA-seq experimental protocol for ErbBi-treated zebrafish embryos (24 hpf). ErbBi treatment: 4–24 hpf. (B) UMAP of GFP+, mCherry+, and GFP+ mCherry+ cells (n = 346 cells) from ErbBi-treated embryos after Louvain clustering (dims = 10, resolution = 0.5). (C) Pseudotime ordering of the cells in (B). Left: pseudocoloring based on pseudotime scores. Right: pseudocoloring based on cluster identity. (D) UMAP of GFP+, mCherry+, and GFP+ mCherry+ cells (n = 1,343 cells) from untreated and ErbBi-treated embryos after Louvain clustering (dims = 12, resolution = 1). (E) UMAP in (D) pseudocolored with the cell origin. Dashed lines highlight clusters enriched with ErbBi-treated cells. (F) Pseudotime ordering of the cells in (D). Cell states present in the untreated embryos (dashed box) are absent in ErbBi-treated embryos. Top left: pseudocoloring based on pseudotime scores. Bottom left: pseudocoloring based on cluster identity. Right: split views (by treatment). Cell states and their inferred position in the 24-hpf embryo are also indicated. (G) ErbB kinase-dependent McSCs (red) and MI+ cells (brown) are highlighted on UMAP presented in Figure 2B. (H) Minimum spanning tree presented in Figure 2E pseudocolored according to the cell states described in (F). The inferred position and the McSC branchpoint are indicated. See also Figures S1 and S4 and Tables S1 and S2. |
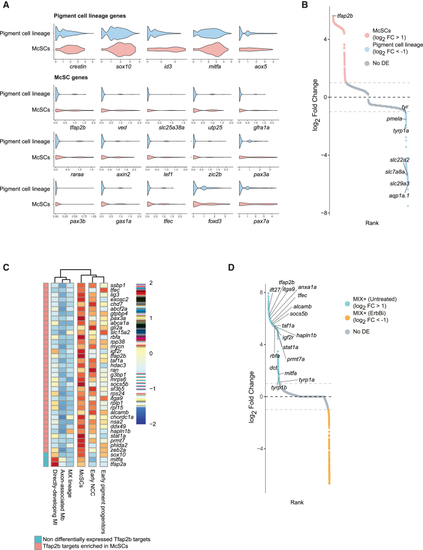
McSC identity is specified by a Tfap2b transcriptional program (A) Violin plots of pigment progenitor and McSC gene expression levels. McSCs differentially express a subset of genes (McSC genes) and share expression with cells of the pigment cell lineage (early pigment progenitors, MI+, MX+, and Mbs from untreated embryos in Figure 3F). (B) Rank plot of differential expression analysis between McSCs and all other states of the pigment lineage. The top differentially expressed gene is tfap2b (log2 fold change = 5.63; adjusted p = 4.99e−5). (C) Clustered heatmap showing the average expression of 36 Tfap2b targets (orthologs of the targets found in chick by Ling and Sauka-Spengler, 2019) enriched in McSCs and 3 non-differentially expressed targets (sox10, mitfa, and tfap2a). (D) Rank plot of differential expression analysis between MIX+ cells from untreated embryos and ErbBi-treated embryos. Most of the McSC-Tfap2b target genes are depleted from MIX+ cells in treated embryos. See also Figure S5 and Tables S3, S4, S5, S6, and S7. |
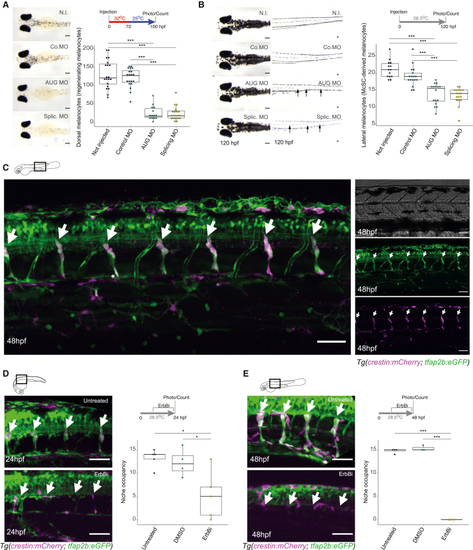
tfap2b is expressed at the McSC niche and required for regeneration (A) tfap2b is required for melanocyte regeneration from the McSC. Shown are images of zebrafish embryos and melanocyte quantification following knockdown of tfap2b in a mitfavc7 regeneration assay. Tukey HSD test, ∗∗∗p < 0.0001 (3 replicates, 20 embryos/condition/replicate). Lines in boxes indicate the medians, and whiskers indicate data within 1.5 interquartile range of the upper and lower quartiles. Scale bars, 200 μm. N.I., not injected; Co. MO, control MO; AUG MO, AUG-directed MO; Splic. MO, splicing MO. (B) tfap2b is required for late-stage melanocytes from the McSC. Shown are Images of zebrafish embryos and melanocyte quantification following knockdown of tfap2b. Only McSC-derived late-developing lateral stripe melanocytes are reduced in tfap2b knockdown embryos. Arrows highlight missing lateral stripe melanocytes. Tukey HSD test; ∗∗∗p < 0.0001 (3 replicates, 20 embryos/condition/replicate). Lines in boxes indicate the medians, and whiskers indicate data within 1.5 interquartile range of the upper and lower quartiles. Scale bars, 200 μm. (C) tfap2b:eGFP expression in the McSC. Shown is a merged image of a double-transgenic Tg(tfap2b:eGFP; crestin:mCherry) zebrafish (left) and separated channel images (bright-field, GFP, and mCherry channel). White arrows indicate GFP+/mCherry+ McSCs at the DRGs. Scale bars, 50 μm. (D and E) tfap2b+ McSCs require ErbB kinase at the niche. Shown are Tg(tfap2b:eGFP;crestin:mCherry) embryos at 24 hpf (D) and 48 hpf (E), untreated or treated with ErbBi. White arrows indicate the McSC niche. Tukey HSD test; ∗p = 0.0172, ∗∗∗p < 0.0001 (3 replicates, 5 embryos/condition/replicate). Lines in boxes indicate the medians, and whiskers indicate data within 1.5 interquartile range of the upper and lower quartiles. Confocal stacks, 30 μm; STD projection. Scale bars, 50 μm. See also Figure S5. |
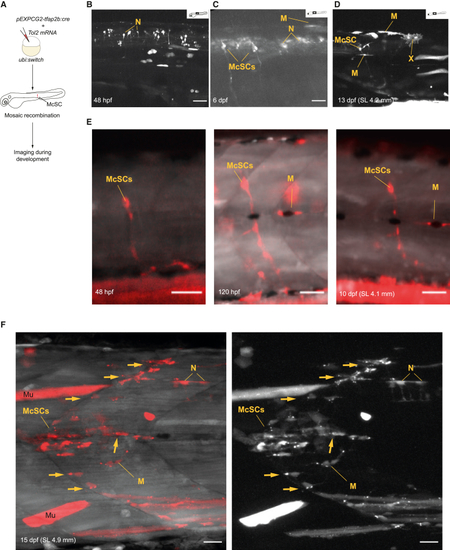
Individual tfap2b+ McSCs during development and at the onset of metamorphosis (A) Experimental protocol overview for tfap2b+ mosaic lineage tracing. pEXP-GC2Tol2-tfap2b:cre and Tol2 mRNAs were injected into ubi:switch embryos at the zygote stage and imaged at different stages to identify mCherry+ McSCs and progenitors. (B–D) tfap2b lineage tracing during zebrafish development at (B) 48 hpf, (C) 6 dpf, and (D) 13 dpf (standard length [SL], 4.2 mm). Shown are representative images of 7–8 animals imaged per stage (1 technical replicate). White pseudocoloring is used for mCherry. Maximum intensity (MAX) projection. Scale bars, 50 μm. (E) Example of a single McSC followed through development of a single fish and imaged at 48 hpf (left), 120 hpf (center), and 10 dpf (SL, 4.1 mm; right). The McSC produces progenitors that populate the ventrally located axonal projection and a lateral line-associated melanocyte. The embryo was injected with 1.5 pg/nL of tfap2b:cre. Scale bars, 50 μm. (F) Dramatic expansion of progenitors from the McSCs at the onset of the metamorphosis. Shown is a confocal imaging of a clone expanding from a single McSC at 15 dpf (SL, 4.9 mm). Arrows indicate axon-associated cells. White pseudocoloring is used for the GFP channel and red for the mCherry channel in the left panel, and white pseudocoloring is used for the mCherry channel in the right panel. The embryo was injected with 1.5 pg/nL of tfap2b:cre. Scale bars, 20 μm. I, iridophore, M, melanocyte; Mu, muscle (off-target signal); McSC, melanocyte stem cell; N, NT/spinal cord neuron; X, xanthophore. See also Figure S5. |
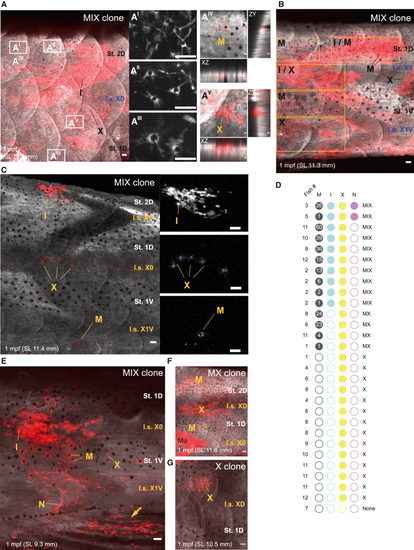
tfap2b+ McSCs have multifate potential for all adult pigment cell lineages (A–C) MIX clones in tfap2b lineage tracing analysis in the adult pigment pattern. Shown are the (A) caudal trunk, (B) tail region, and (C) medial trunk. Magnified images of melanocytes are presented in stripes 2D (AI and AII) and 1D (AIII). Orthogonal projections of a melanocyte (AIV) and a xanthophore (AV) show that cells are localized in the scale. Also shown are (B) a MIX clone spanning the dorsoventral axis and (C) a sparse MIX clone, with magnifications of iridophores, xanthophores, and a melanocyte (top to bottom). White pseudocoloring is used for the GFP channel, and red is used for the mCherry channel in (A)–(C). white pseudocoloring is used for the mCherry channel in the magnified panels and AI–AIII and in (C) magnified images. Shown are representative images of more than 20 fish injected with 25 pg/nL of tfap2b:cre. MAX projection. Scale bars, 50 μm. (D) Frequencies of the different derivatives in clearly defined clones in 12 juvenile ubi:switch zebrafish injected with low doses of the tfap2b:cre plasmid (1.5 pg/nL, 3.25 pg/nL, and 6 pg/nL). Fish SL in millimeters: (1) 9.7, (2) 8.7, (3) 7.1, (4) 10.5, (5) 9.3, (6) 11.6, (7) 11.1, (8) 10.6, (9) 12.4, (10) 11.2, (11) 13.7, and (12)15.5. Clones were named according to their pigment cell composition. Numbers in the black dots represent mCherry+ melanocytes within the clone. (E−G) Representative images of the clones analyzed in (D). Shown are (E) a MIX clone with a clone-associated nerve (caudal trunk; the arrow indicates clone extension into the anal fin), (F) an MX clone (medial trunk), and (G) an X clone (rostral trunk). MAX projection. Scale bars, 50 μm. All fish were injected with 1.5 pg/nL of tfap2b:cre. I.s., interstripe; St., stripe. See also Figure S6. |