
Figure 2
- ID
- ZDB-FIG-220131-51
- Publication
- Brombin et al., 2022 - Tfap2b specifies an embryonic melanocyte stem cell that retains adult multifate potential
- Other Figures
- All Figure Page
- Back to All Figure Page
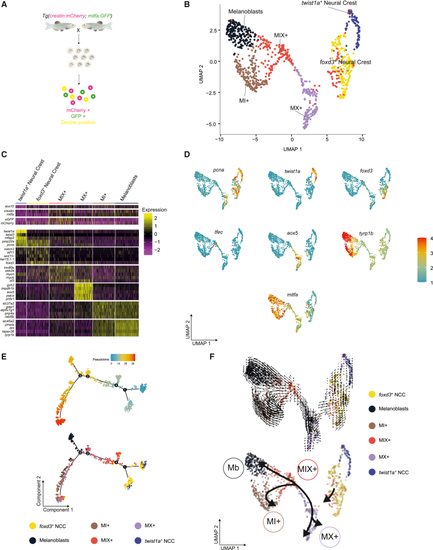
scRNA-seq identifies six distinct NC pigment cell lineage populations (A) Schematic of the experimental protocol. GFP+ and/or mCherry+ cells were isolated from Tg(crestin:mCherry; mitfa:GFP) embryos at 24 hpf. (B) UMAP of GFP+, mCherry+, and double-positive cells (n = 996 cells) obtained after Louvain clustering (dimensions, dims = 20, resolution = 0.5). (C) Heatmap showing the average log2 fold change expression of five selected genes per cluster identified in (B). The average log2 fold change expression across the 6 clusters of sox10, crestin, mitfa, mCherry, and GFP expression levels are also presented for comparison. (D) UMAP representations of (B) with color change from blue (negative) to red (positive) based on log2 mRNA expression of pcna, twist1a, foxd3, aox5, tfec, mitfa, and tyrp1b. (E) Pseudotime ordering of the cells in (B). Top: pseudocoloring based on pseudotime scores. Bottom: pseudocoloring based on cluster identity. (F) RNA velocity analysis of the UMAP represented in (B) (top) and simplified representation (bottom). See also Figures S1–S3 and Tables S1 and S2. |