
Figure 5
- ID
- ZDB-FIG-220131-56
- Publication
- Brombin et al., 2022 - Tfap2b specifies an embryonic melanocyte stem cell that retains adult multifate potential
- Other Figures
- All Figure Page
- Back to All Figure Page
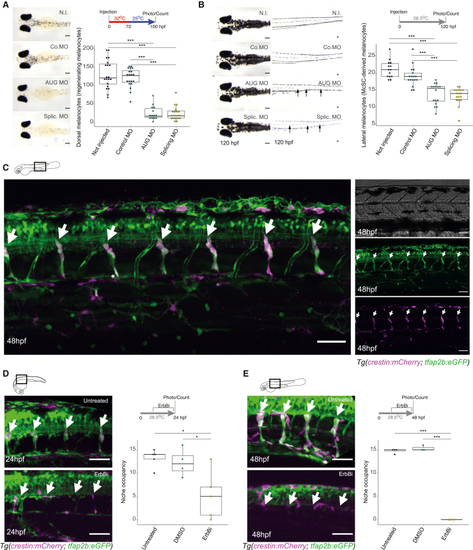
tfap2b is expressed at the McSC niche and required for regeneration (A) tfap2b is required for melanocyte regeneration from the McSC. Shown are images of zebrafish embryos and melanocyte quantification following knockdown of tfap2b in a mitfavc7 regeneration assay. Tukey HSD test, ∗∗∗p < 0.0001 (3 replicates, 20 embryos/condition/replicate). Lines in boxes indicate the medians, and whiskers indicate data within 1.5 interquartile range of the upper and lower quartiles. Scale bars, 200 μm. N.I., not injected; Co. MO, control MO; AUG MO, AUG-directed MO; Splic. MO, splicing MO. (B) tfap2b is required for late-stage melanocytes from the McSC. Shown are Images of zebrafish embryos and melanocyte quantification following knockdown of tfap2b. Only McSC-derived late-developing lateral stripe melanocytes are reduced in tfap2b knockdown embryos. Arrows highlight missing lateral stripe melanocytes. Tukey HSD test; ∗∗∗p < 0.0001 (3 replicates, 20 embryos/condition/replicate). Lines in boxes indicate the medians, and whiskers indicate data within 1.5 interquartile range of the upper and lower quartiles. Scale bars, 200 μm. (C) tfap2b:eGFP expression in the McSC. Shown is a merged image of a double-transgenic Tg(tfap2b:eGFP; crestin:mCherry) zebrafish (left) and separated channel images (bright-field, GFP, and mCherry channel). White arrows indicate GFP+/mCherry+ McSCs at the DRGs. Scale bars, 50 μm. (D and E) tfap2b+ McSCs require ErbB kinase at the niche. Shown are Tg(tfap2b:eGFP;crestin:mCherry) embryos at 24 hpf (D) and 48 hpf (E), untreated or treated with ErbBi. White arrows indicate the McSC niche. Tukey HSD test; ∗p = 0.0172, ∗∗∗p < 0.0001 (3 replicates, 5 embryos/condition/replicate). Lines in boxes indicate the medians, and whiskers indicate data within 1.5 interquartile range of the upper and lower quartiles. Confocal stacks, 30 μm; STD projection. Scale bars, 50 μm. See also Figure S5. |