
Figure 3
- ID
- ZDB-FIG-220131-52
- Publication
- Brombin et al., 2022 - Tfap2b specifies an embryonic melanocyte stem cell that retains adult multifate potential
- Other Figures
- All Figure Page
- Back to All Figure Page
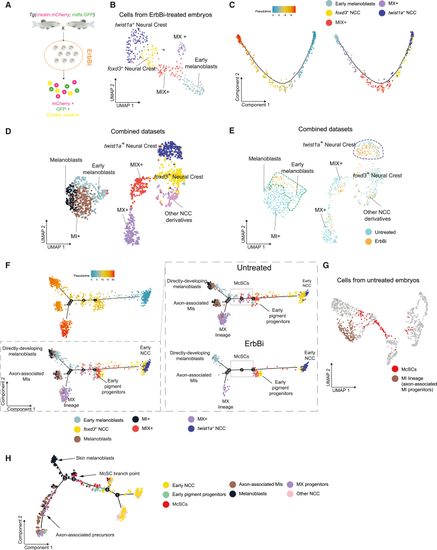
Identification of ErbB-dependent McSCs by scRNA-seq (A) Schematic of the scRNA-seq experimental protocol for ErbBi-treated zebrafish embryos (24 hpf). ErbBi treatment: 4–24 hpf. (B) UMAP of GFP+, mCherry+, and GFP+ mCherry+ cells (n = 346 cells) from ErbBi-treated embryos after Louvain clustering (dims = 10, resolution = 0.5). (C) Pseudotime ordering of the cells in (B). Left: pseudocoloring based on pseudotime scores. Right: pseudocoloring based on cluster identity. (D) UMAP of GFP+, mCherry+, and GFP+ mCherry+ cells (n = 1,343 cells) from untreated and ErbBi-treated embryos after Louvain clustering (dims = 12, resolution = 1). (E) UMAP in (D) pseudocolored with the cell origin. Dashed lines highlight clusters enriched with ErbBi-treated cells. (F) Pseudotime ordering of the cells in (D). Cell states present in the untreated embryos (dashed box) are absent in ErbBi-treated embryos. Top left: pseudocoloring based on pseudotime scores. Bottom left: pseudocoloring based on cluster identity. Right: split views (by treatment). Cell states and their inferred position in the 24-hpf embryo are also indicated. (G) ErbB kinase-dependent McSCs (red) and MI+ cells (brown) are highlighted on UMAP presented in Figure 2B. (H) Minimum spanning tree presented in Figure 2E pseudocolored according to the cell states described in (F). The inferred position and the McSC branchpoint are indicated. See also Figures S1 and S4 and Tables S1 and S2. |