
|
Figure 4
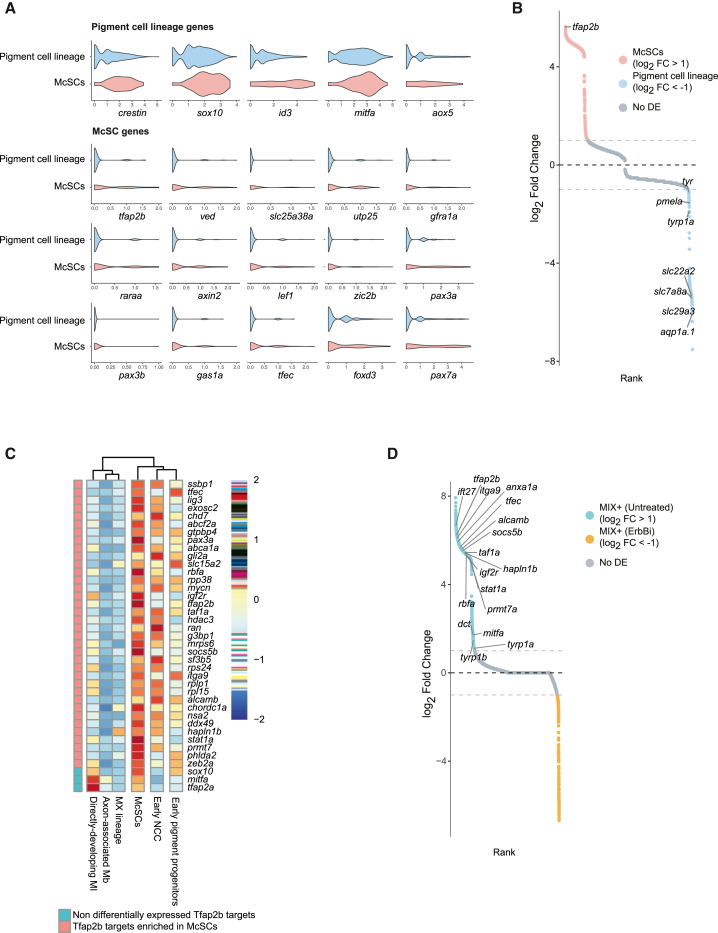
McSC identity is specified by a Tfap2b transcriptional program
(A) Violin plots of pigment progenitor and McSC gene expression levels. McSCs differentially express a subset of genes (McSC genes) and share expression with cells of the pigment cell lineage (early pigment progenitors, MI+, MX+, and Mbs from untreated embryos in Figure 3F).
(B) Rank plot of differential expression analysis between McSCs and all other states of the pigment lineage. The top differentially expressed gene is tfap2b (log2 fold change = 5.63; adjusted p = 4.99e−5).
(C) Clustered heatmap showing the average expression of 36 Tfap2b targets (orthologs of the targets found in chick by Ling and Sauka-Spengler, 2019) enriched in McSCs and 3 non-differentially expressed targets (sox10, mitfa, and tfap2a).
(D) Rank plot of differential expression analysis between MIX+ cells from untreated embryos and ErbBi-treated embryos. Most of the McSC-Tfap2b target genes are depleted from MIX+ cells in treated embryos.
See also Figure S5 and Tables S3, S4, S5, S6, and S7.