
|
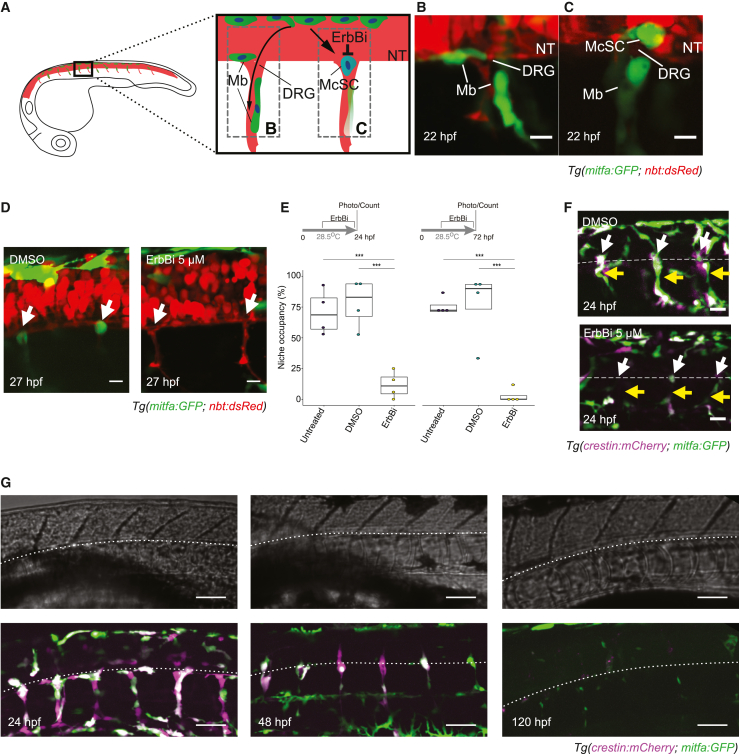
Figure 1
McSCs maintain an NC identity at the niche
(A–C) Schematic of developing McSCs and melanocytes in the zebrafish embryo. mitfa-expressing melanoblasts (Mbs; green) develop directly from the NC and travel to the skin dorsolaterally (data not shown) or ventrally along the neural tube (NT) and peripheral nerves (red; B). A subset of those cells establishes at the site of the of the perspective dorsal root ganglia (DRGs) and become McSCs (blue; C). McSC establishment is sensitive to ErbB-kinase inhibitors (ErbBi).
(B and C) Melanoblasts migrating along the axons (B) and a newly established McSC at the site of a perspective DRG (C). Shown are confocal stacks (20 μm) of Tg(mitfa:GFP; nbt:dsRed) embryos imaged laterally at 22 hpf. Scale bars, 20 μm.
(D) ErbB kinase activity is required for McSC establishment at the niche (white arrow). Shown are confocal stacks (20 μm) of Tg(mitfa:GFP; nbt:dsRed) embryos treated with DMSO or ErbBi. Standard deviation (STD) projection. Scale bars, 20 μm.
(E) Quantification of McSC niche occupancy. Tukey honestly significant difference (HSD) test; ∗∗∗p < 0.0001 (3 replicates, 5 embryos/condition/replicates). Lines in boxes indicate the medians, and whiskers indicate data within 1.5 interquartile range of the upper and lower quartiles.
(F) McSCs maintain NC identity at the niche. Shown are confocal stacks (30 μm) of Tg(crestin:mCherry; mitfa:GFP) embryos treated with DMSO or ErbBi. McSCs (white arrows) and nerve-associated cells (yellow arrows) are dependent on ErbB kinase. STD projection. Scale bars, 20 μm.
(G) McSCs and nerve-associated precursors express mitfa:GFP and crestin:mCherry, but expression is lost by 120 hpf. Shown are confocal stacks (30 μm) of Tg(crestin:mCherry; mitfa:GFP) embryos. The lower edge of the NT is indicated (white dotted line) on fluorescence and corresponding bright-field images (top). Bright-field, average intensity (AVG) projection; fluorescence, STD projection. Scale bars, 50 μm.