
- Title
-
Protein tyrosine phosphatase receptor zeta 1 deletion triggers defective heart morphogenesis in mice and zebrafish
- Authors
- Katraki-Pavlou, S., Kastana, P., Bousis, D., Ntenekou, D., Varela, A., Davos, C.H., Nikou, S., Papadaki, E., Tsigkas, G., Athanasiadis, E., Herradon, G., Mikelis, C.M., Beis, D., Papadimitriou, E.
- Source
- Full text @ Am. J. Physiol. Heart Circ. Physiol.
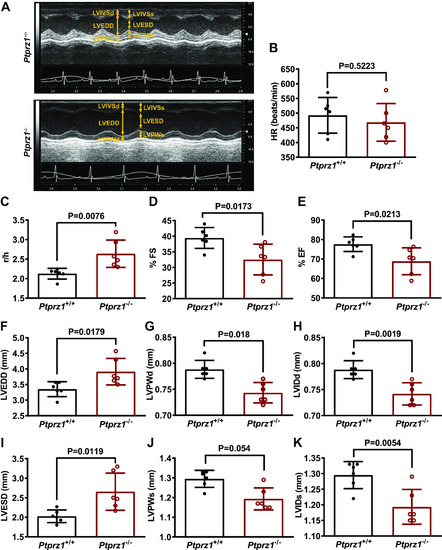
Cardiac ultrasound in Ptprz1−/− and Ptprz1+/+ mouse hearts. A: representative cardiac ultrasound images of the LV at the level of the papillary muscle before the mitral valve. These are short axis mode images, which show from above to below the interventricular wall, the cavity, and the posterior wall of the left ventricle. B–K: quantitative data derived from such images are shown and data in all cases are expressed as means ± SD from 6 Ptprz1−/− and 6 Ptprz1+/+ mice at the age of 3 mo. Statistical analysis was performed by Student’s unpaired t test. HR, heart rate; LV, left ventricle; LVEDD, left ventricular end-diastolic diameter; LVESD, left ventricular end-systolic diameter; LVIDd, left ventricular internal dimension at end-diastole; LVISd, left ventricular internal dimension at end systole; LVPWd, left ventricular posterior wall thickness at end-diastole; LVPWs, left ventricular posterior wall thickness at end systole; %EF, percent ejection fraction; %FS, percent fractional shortening; r/h, left ventricular radius to left ventricular posterior wall thickness ratio. |
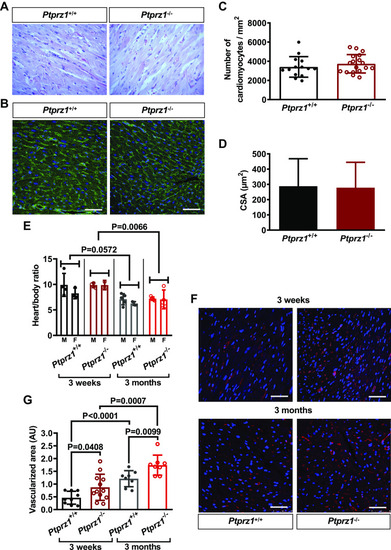
Histological evaluation and angiogenesis in Ptprz1−/− and Ptprz1+/+ mouse hearts. A: representative images at ×40 magnification of H&E staining of heart tissue sections from 3 Ptprz1−/− and 3 Ptprz1+/+ male mice at the age of 3 mo. B: representative images of WGA-stained heart tissue sections from Ptprz1−/− and Ptprz1+/+ male mice. Scale bar corresponds to 50 μm. C and D: the number of cardiomyocytes per mm2 and the CSA of 10 cardiomyocytes per slide was measured in at least 4 different slides from each of 3 different mice from each group. Results are expressed as means ± SD of the number of cardiomyocytes per mm2 (C) or the calculated cardiomyocyte CSA expressed in μm2 (D). E: calculated heart to body ratio expressed as means ± SD (n ≥ 5) at 2 different ages is shown. Statistical analysis was performed by Student’s unpaired t test. Both male (M) and female (F) mice were used, and no difference related to sex has been identified. F: paraffin-embedded hearts from Ptprz1−/− and Ptprz1+/+ male mice at the age of 3 wk or 3 mo were stained with rhodamine-conjugated Griffonia simplicifolia for endothelial cells (red). Nuclei were stained with Draq5 (blue). Representative pictures are shown, and scale bars correspond to 50 μm. G: Griffonia simplicifolia lectin-positive endothelial cells per heart area were measured in 2–4 different fields/photo from 3 different animals from each group. Results are expressed as means ± SD of the vascularized cardiac tissue area in arbitrary units (AU). Statistical analysis in all cases was performed by Student’s unpaired t test. CSA, cross-sectional area; H&E, hematoxylin & eosin ; WGA, wheat germ agglutinin. |
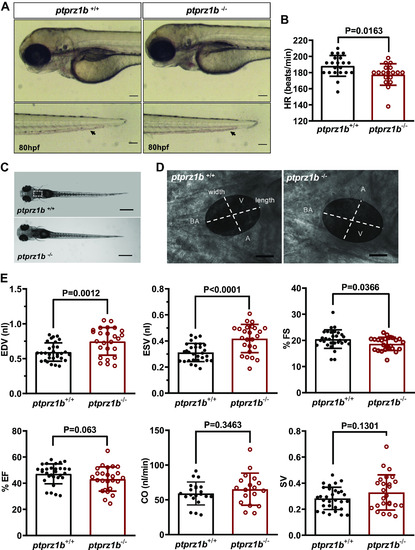
Ptprz1b−/− zebrafish larvae have defective heart rate (HR), enlarged ventricles, and defective contractility. A: Ptprz1b+/+ and ptprz1b −/− embryos at 80 hpf exhibit similar morphology (images are lateral views, anterior to the left, dorsal to the top). Ptprz1b −/− embryos exhibit lower blood flow (black arrows, embryo tails). Scale bars correspond to 100 μm. B: HR expressed as means ± SD (ptprz1b+/+: n = 30 and ptprz1b−/−: n = 20); statistical analysis was performed by Student’s unpaired t test. C: microscope images illustrating the morphology of 5 dpf ptprz1b+/+ and ptprz1b−/− mutants as seen from a left lateral. The heart area is marked with a white dashed box. Scale bars correspond to 500 μm. D: representative images of 5 dpf embryos’ hearts (vertical view) at fully diastole phase. Images are individual frames from high-speed microscope imaging, recording embryonic cardiac beating. The ventricular area of the heart is highlighted, with the length (long axis) and width (short axis) of the ventricle indicated by dashed lines. Scale bars correspond to 50 μm. E: quantification of cardiac function at 5 dpf. Results are expressed as means ± SD (ptprz1b+/+: n = 30, ptprz1b−/−: n = 20) and statistical analysis was performed by Student’s unpaired t test and Mann–Whitney test. A, atrium; BA, bulbous arteriosus; CO, cardiac output; dpf, days postfertilization; EDV, end-diastole volume; ESV, end-systolic volume; %EF, percent ejection fraction; %FS, percent fractional shortening; SV, stroke volume; V, ventricle. PHENOTYPE:
|
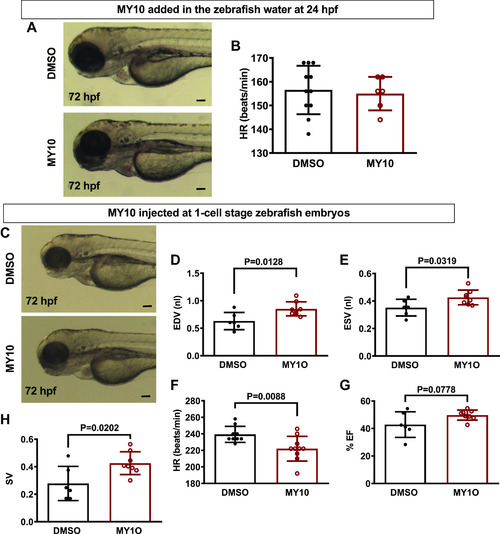
The effect of the protein tyrosine phosphatase receptor-ζ1 (PTPRZ1)-selective tyrosine phosphatase inhibitor MY10 in zebrafish heart. A: MY10 was added in the water of 24 hpf zebrafish embryos and the latter were observed under a stereoscope and photographed at 72 hpf. Scale bar corresponds to 100 μm. B: HR is expressed as means ± SD of heart beats/min (DMSO 0.1%: n = 9, MY10 10−5 M: n = 10). C: MY10 was injected at 1-cell stage embryos and the injected embryos were observed and photographed at 72 hpf. Scale bar corresponds to 100 μm. D–H: quantification of cardiac function of injected embryos at 5 dpf. Data are expressed as means ± SD (DMSO: n = 6, MY10: n = 8). Statistical analysis was performed by Student’s unpaired t test. dpf, days postfertilization; EDV, end-diastole volume; ESV, end-systolic volume; hpf, hours postfertilization; HR, heart rate; %EF, percent ejection fraction; SV, stroke volume. |
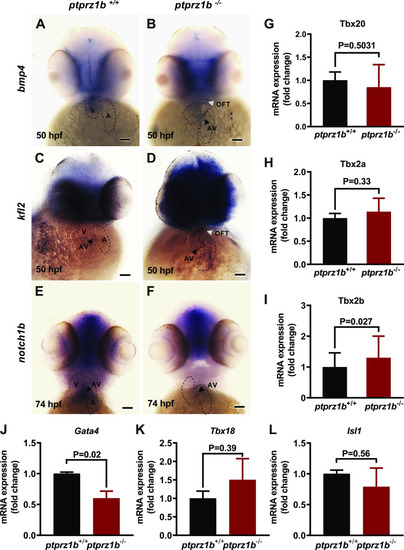
Expression of cardiac markers during zebrafish cardiac development. A–F: expression of cardiac genes using whole mount antisense ISH. The boundaries of the heart are drawn with dashed lines, black arrowheads indicate the location of the atrioventricular valves (AV), whereas white arrowheads indicate the outflow tract (OFT). Scale bars correspond to 100 μm. G–I: T-box family genes relative expressions. J–L: cardiac development regulator genes relative expressions. For G–L, RNA was isolated from ptprz1b+/+ and ptprz1b−/− embryos at 3 and 5 dpf and mRNA levels were determined by qRT-PCR and calculated by the 2ΔCT method. Results are expressed as means ± SD (n = 4) and statistical analysis was performed by Student’s unpaired t test. hpf, hours postfertilization; ISH, in situ hybridization; OFT, outflow tract; A, atrium; V, ventricle; AV, atrioventricular canal. |
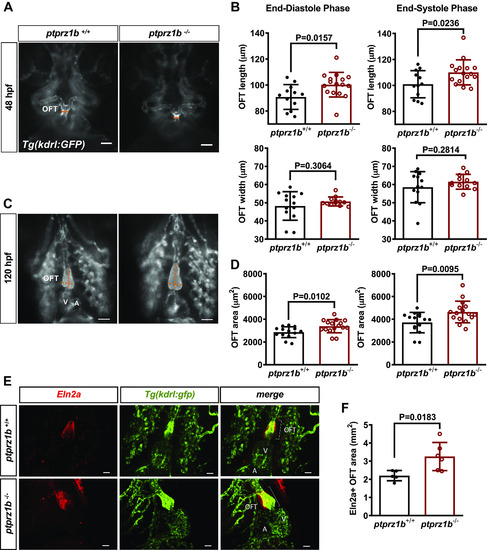
OFT morphogenesis in ptprz1−/− zebrafish embryos. Inverted microscope images at 48 (A) and 120 hpf (C; ventricular orientation) are shown. The width and length of the developing OFT are indicated by the orange lines and the OFT area is displayed in gray. Scale bars correspond to 50 μm. B: quantification of the OFT area at 48 hpf, based on length and width measurements at OFT maximum (end-systolic phase) and minimum (end-diastolic phase) dimensions. D: quantification of the OFT area at 120 hpf. Data in B and D are expressed as means ± SD (n = 16). Statistical analysis was performed by Student’s unpaired t test. E: 7 dpf ptpr1b−/− and ptpr1b+/+ embryos exhibit robust Eln2a+ expression in the OTF (Eln2a: smooth muscle cells). Scale bars correspond to 25 μm. F: quantification of the Eln2a+ area expressed as OFT/BA area (mm2). Data are expressed as means ± SD (ptprz1b+/+: n = 5, ptprz1b−/−: n = 6) and statistical analysis was performed by Student’s unpaired t test. A, atrium; BA, bulbus arteriosus; dpf, days postfertilization; hpf, hours postfertilization; OFT, outflow track; V, ventricle. |
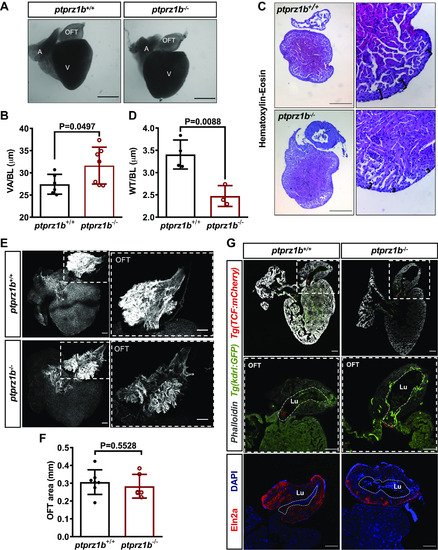
Changes in cardiac anatomy between ptprz1b+/+ and ptprz1b−/− adult zebrafish. A: representative images of hearts collected from adult ptprz1b+/+ and ptprz1b−/− zebrafish. Scale bars correspond to 500 μm. B: quantification of ventricular size expressed as means ± SD of ventricular area/body length (VA/BL) (ptprz1b+/+, n = 6 and ptprz1b−/−, n = 7). C: representative histology images of adult ptprz1b−/− and ptprz1+/+ hearts after H&E staining. Scale bars correspond to 300 μm. D: measurements of wall thickness expressed as means ± SD of wall thickness/body length (WT/BL; n = 3). E: representative confocal images of whole mounted adult hearts (maximum projections). The OFT structure is highlighted by the dashed white box. Scale bars correspond to 100 μm. F: quantification of the OFT area normalized by the total surface area of the respective ventricles and expressed as means ± SD (ptprz1b+/+, n = 7 and ptprz1b−/−, n = 6). G: images of adult heart cryosections, in which the OFT’s lumen is marked with white dashed lines. Scale bars correspond to 100 μm. Statistical analysis in all cases was performed by Student’s unpaired t test. A, atrium; BA, bulbus arteriosus; H&E, hematoxylin & eosin; Lu, lumen; OFT, outflow track; V, ventricle. |
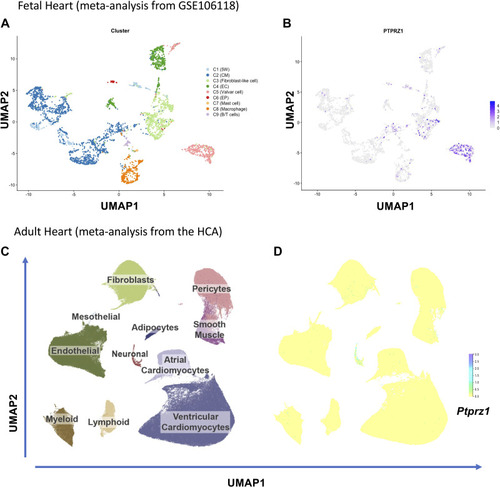
Protein tyrosine phosphatase receptor-ζ1 (PTPRZ1) expression in the fetal and adult human heart. A: eight clusters (C) of cells as identified in the analysis of single-cell RNASeq of fetal hearts. B: uniform manifold approximation and projection (UMAP) representation of Ptprz1 expression in the developing human heart in different types of cells. C: UMAP space colored based on 11 major cardiac cell types across 486,134 cells and nuclei from HCA, as described in https://www.heartcellatlas.org. D: UMAP representation of Ptprz1 expression across 486,134 cells and nuclei from HCA. B/T cells, B and T lymphocytes; CM, cardiomyocytes; EC, endothelial cells; EP, epicardial cells; HCA, Heart Cell Atlas; 5W, 5 weeks hearts. |

ZFIN is incorporating published figure images and captions as part of an ongoing project. Figures from some publications have not yet been curated, or are not available for display because of copyright restrictions. PHENOTYPE:
|
|
ZFIN is incorporating published figure images and captions as part of an ongoing project. Figures from some publications have not yet been curated, or are not available for display because of copyright restrictions. EXPRESSION / LABELING:
PHENOTYPE:
|
|
ZFIN is incorporating published figure images and captions as part of an ongoing project. Figures from some publications have not yet been curated, or are not available for display because of copyright restrictions. |
|
ZFIN is incorporating published figure images and captions as part of an ongoing project. Figures from some publications have not yet been curated, or are not available for display because of copyright restrictions. EXPRESSION / LABELING:
PHENOTYPE:
|