
|
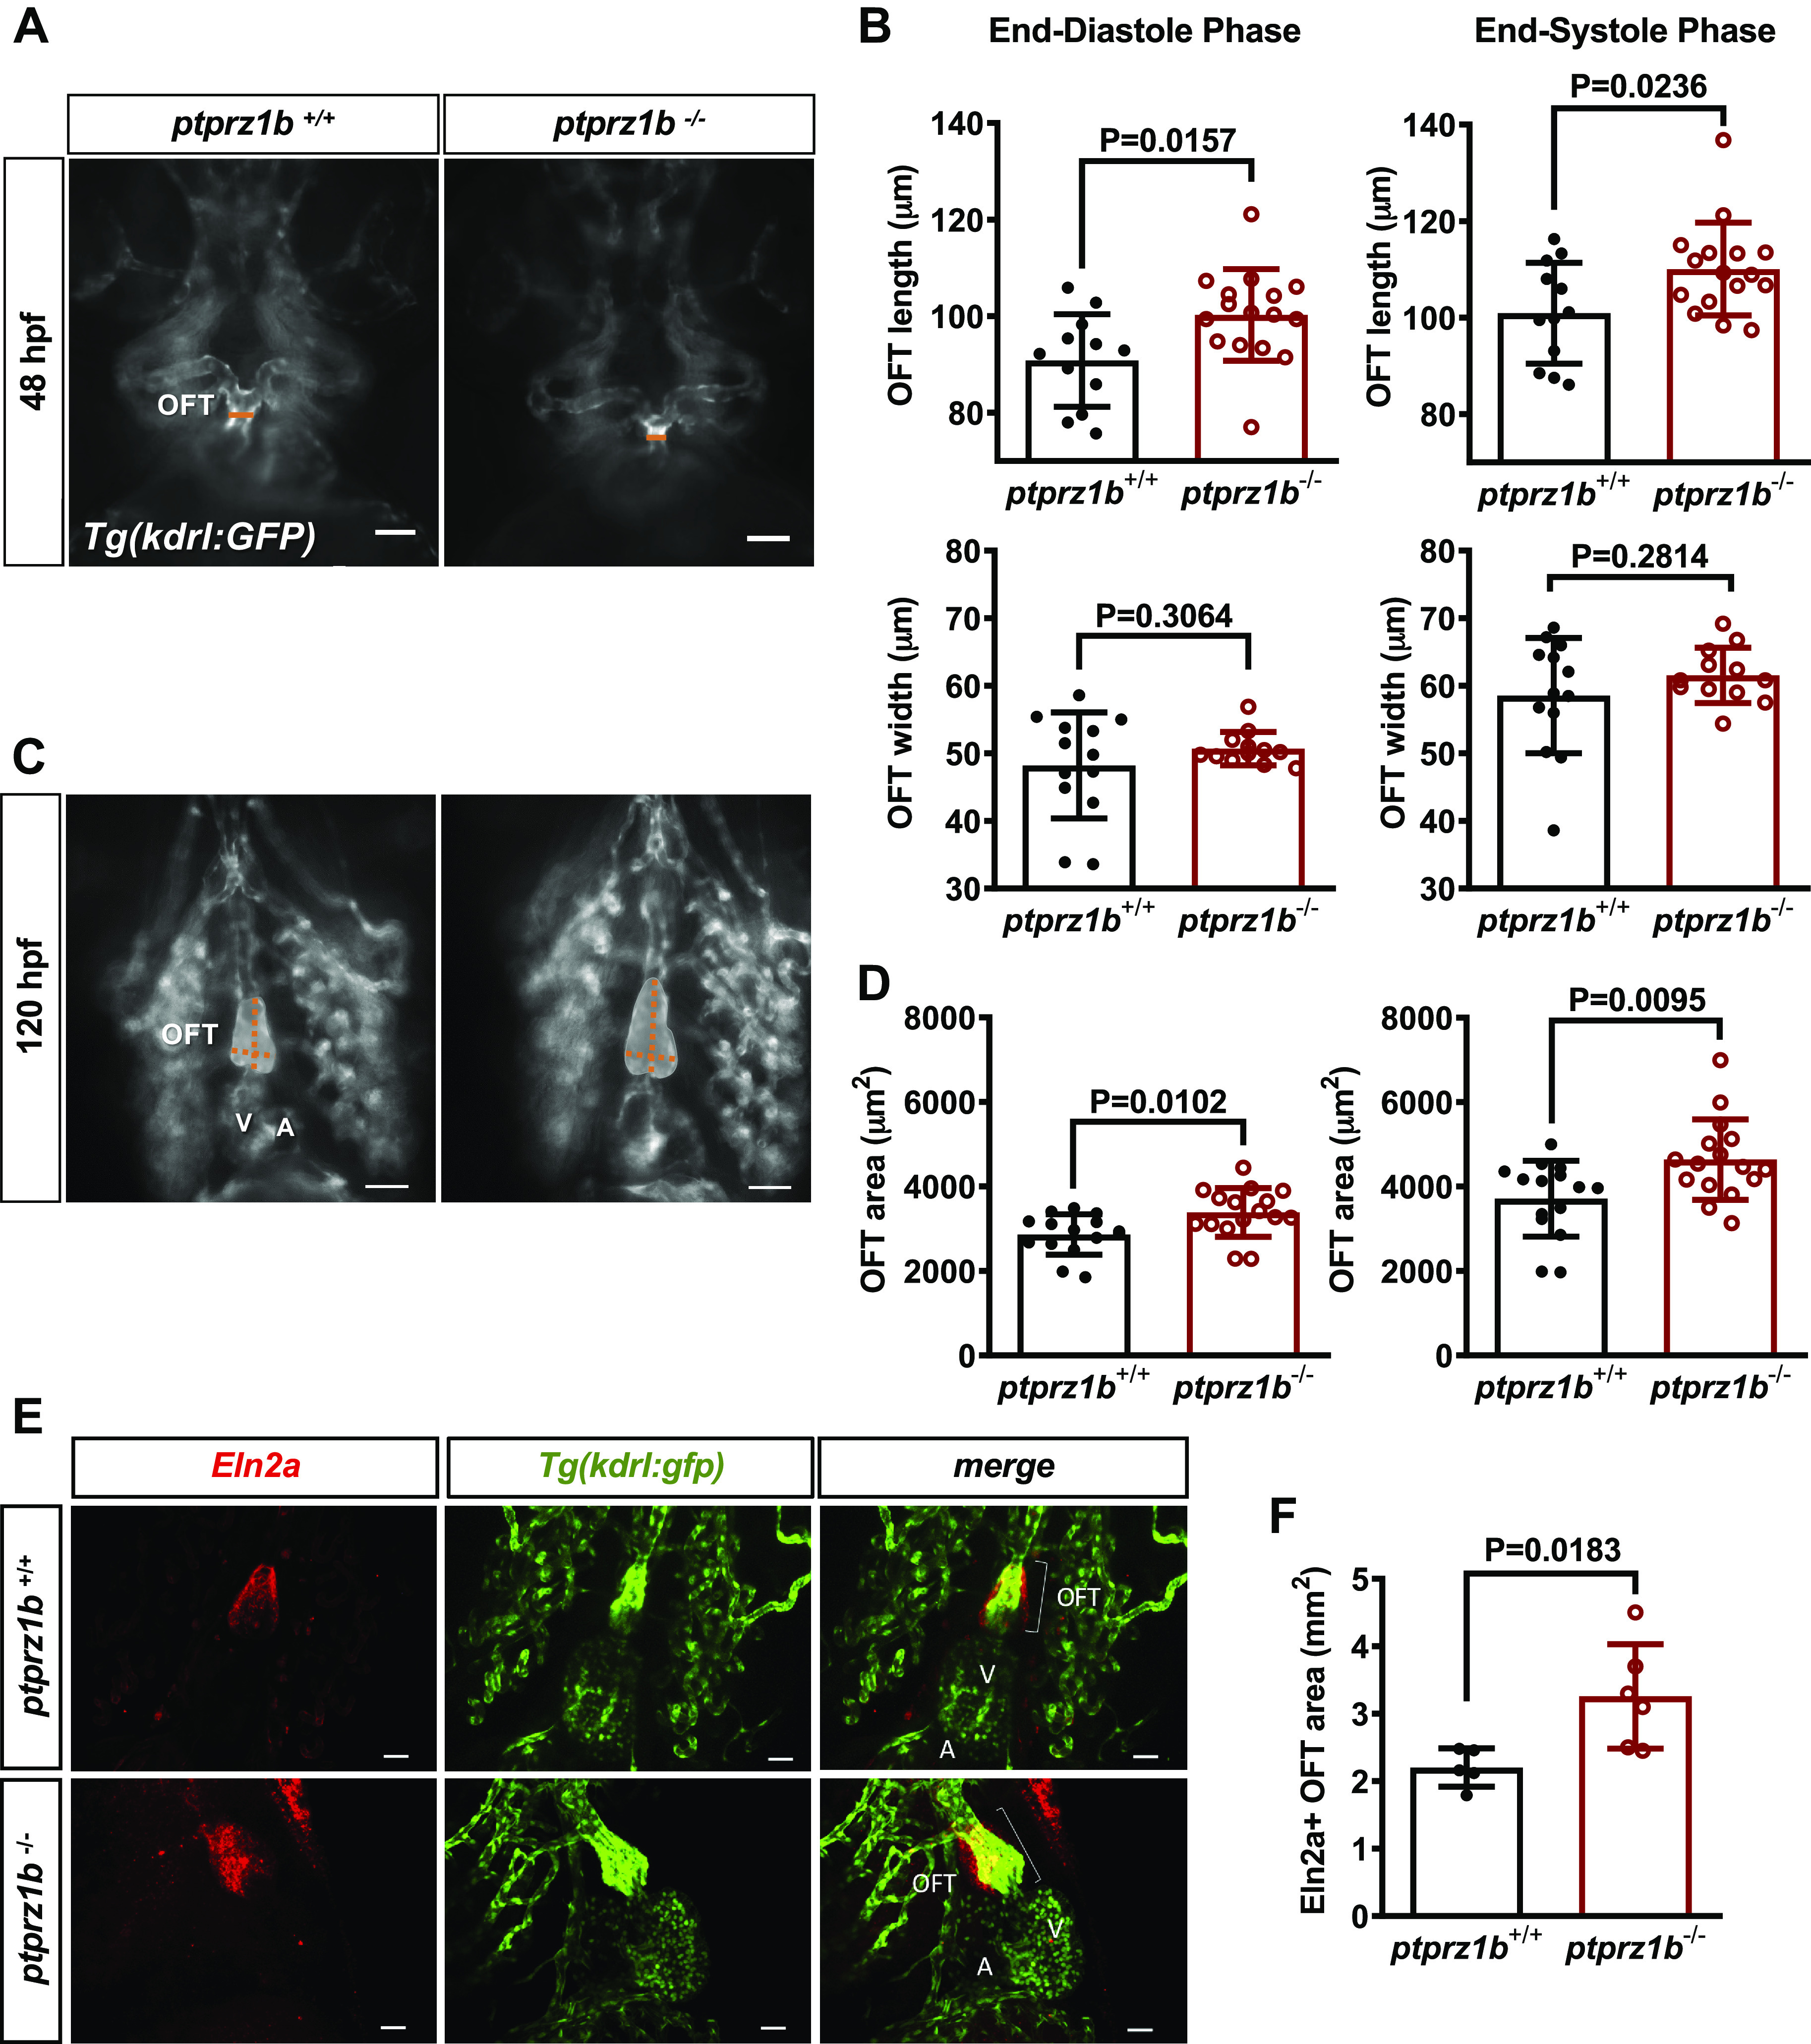
Fig. 6
OFT morphogenesis in ptprz1−/− zebrafish embryos. Inverted microscope images at 48 (A) and 120 hpf (C; ventricular orientation) are shown. The width and length of the developing OFT are indicated by the orange lines and the OFT area is displayed in gray. Scale bars correspond to 50 μm. B: quantification of the OFT area at 48 hpf, based on length and width measurements at OFT maximum (end-systolic phase) and minimum (end-diastolic phase) dimensions. D: quantification of the OFT area at 120 hpf. Data in B and D are expressed as means ± SD (n = 16). Statistical analysis was performed by Student’s unpaired t test. E: 7 dpf ptpr1b−/− and ptpr1b+/+ embryos exhibit robust Eln2a+ expression in the OTF (Eln2a: smooth muscle cells). Scale bars correspond to 25 μm. F: quantification of the Eln2a+ area expressed as OFT/BA area (mm2). Data are expressed as means ± SD (ptprz1b+/+: n = 5, ptprz1b−/−: n = 6) and statistical analysis was performed by Student’s unpaired t test. A, atrium; BA, bulbus arteriosus; dpf, days postfertilization; hpf, hours postfertilization; OFT, outflow track; V, ventricle.