
|
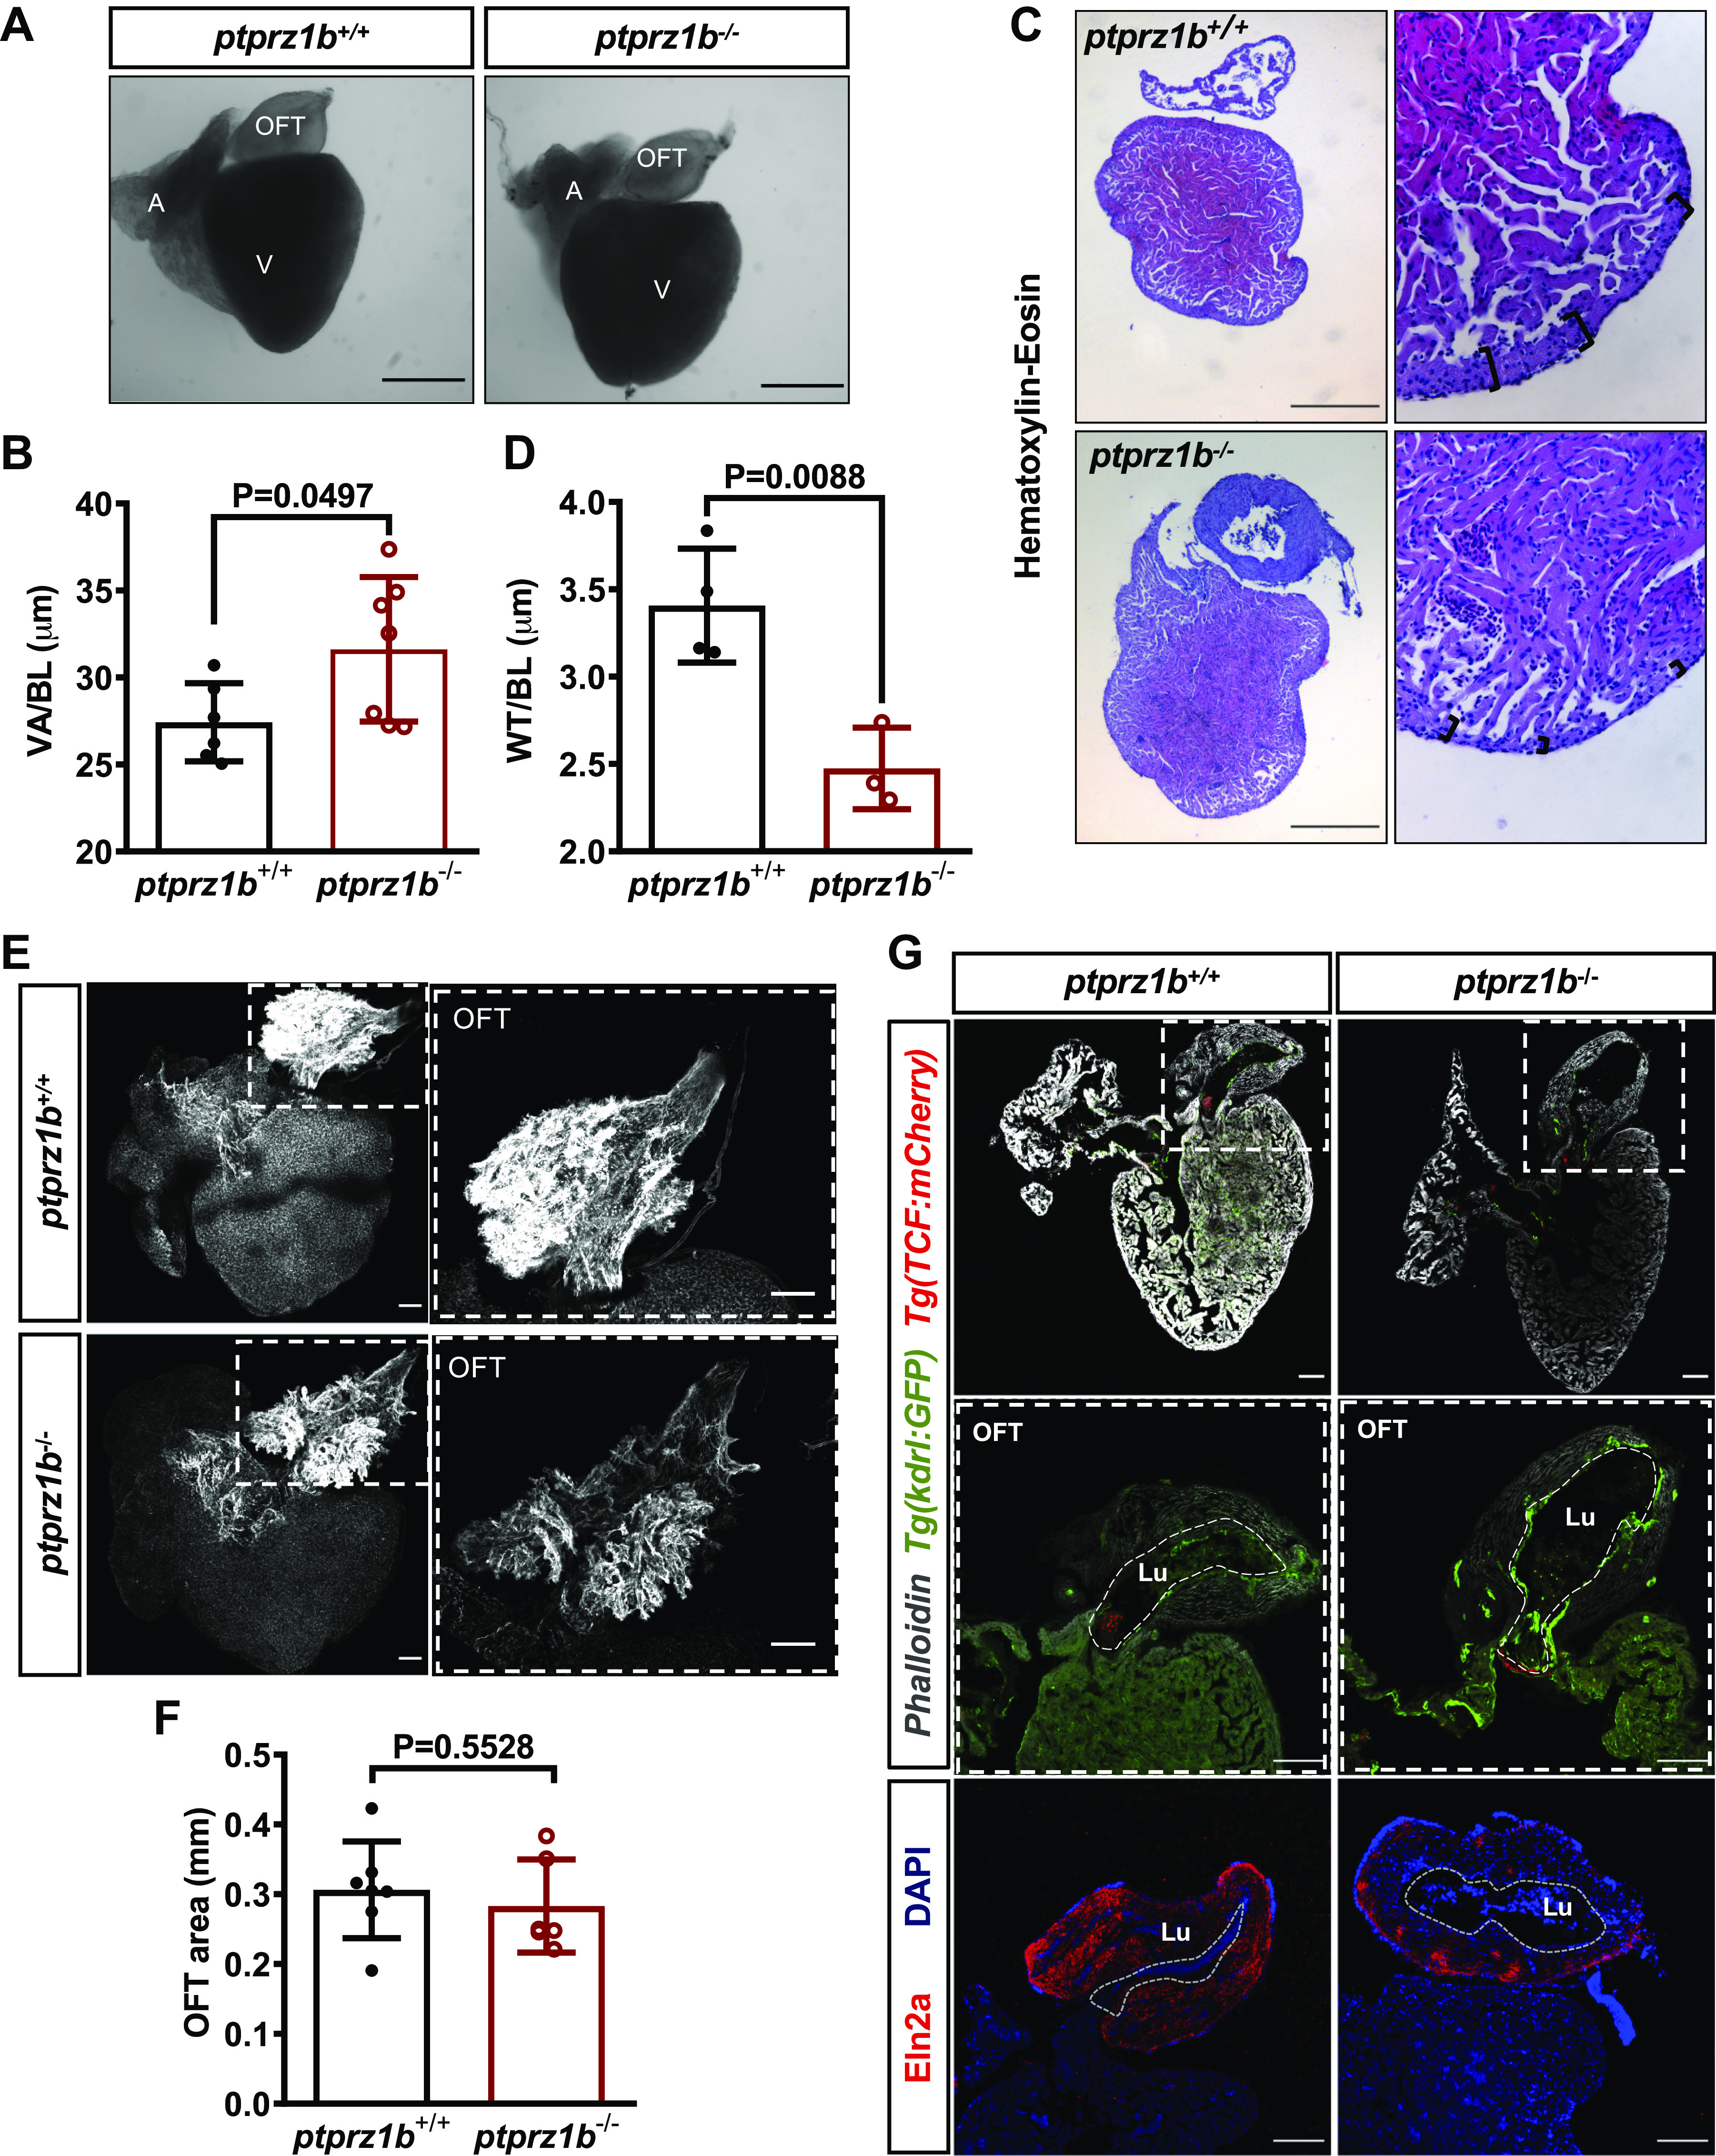
Fig. 7
Changes in cardiac anatomy between ptprz1b+/+ and ptprz1b−/− adult zebrafish. A: representative images of hearts collected from adult ptprz1b+/+ and ptprz1b−/− zebrafish. Scale bars correspond to 500 μm. B: quantification of ventricular size expressed as means ± SD of ventricular area/body length (VA/BL) (ptprz1b+/+, n = 6 and ptprz1b−/−, n = 7). C: representative histology images of adult ptprz1b−/− and ptprz1+/+ hearts after H&E staining. Scale bars correspond to 300 μm. D: measurements of wall thickness expressed as means ± SD of wall thickness/body length (WT/BL; n = 3). E: representative confocal images of whole mounted adult hearts (maximum projections). The OFT structure is highlighted by the dashed white box. Scale bars correspond to 100 μm. F: quantification of the OFT area normalized by the total surface area of the respective ventricles and expressed as means ± SD (ptprz1b+/+, n = 7 and ptprz1b−/−, n = 6). G: images of adult heart cryosections, in which the OFT’s lumen is marked with white dashed lines. Scale bars correspond to 100 μm. Statistical analysis in all cases was performed by Student’s unpaired t test. A, atrium; BA, bulbus arteriosus; H&E, hematoxylin & eosin; Lu, lumen; OFT, outflow track; V, ventricle.