
|
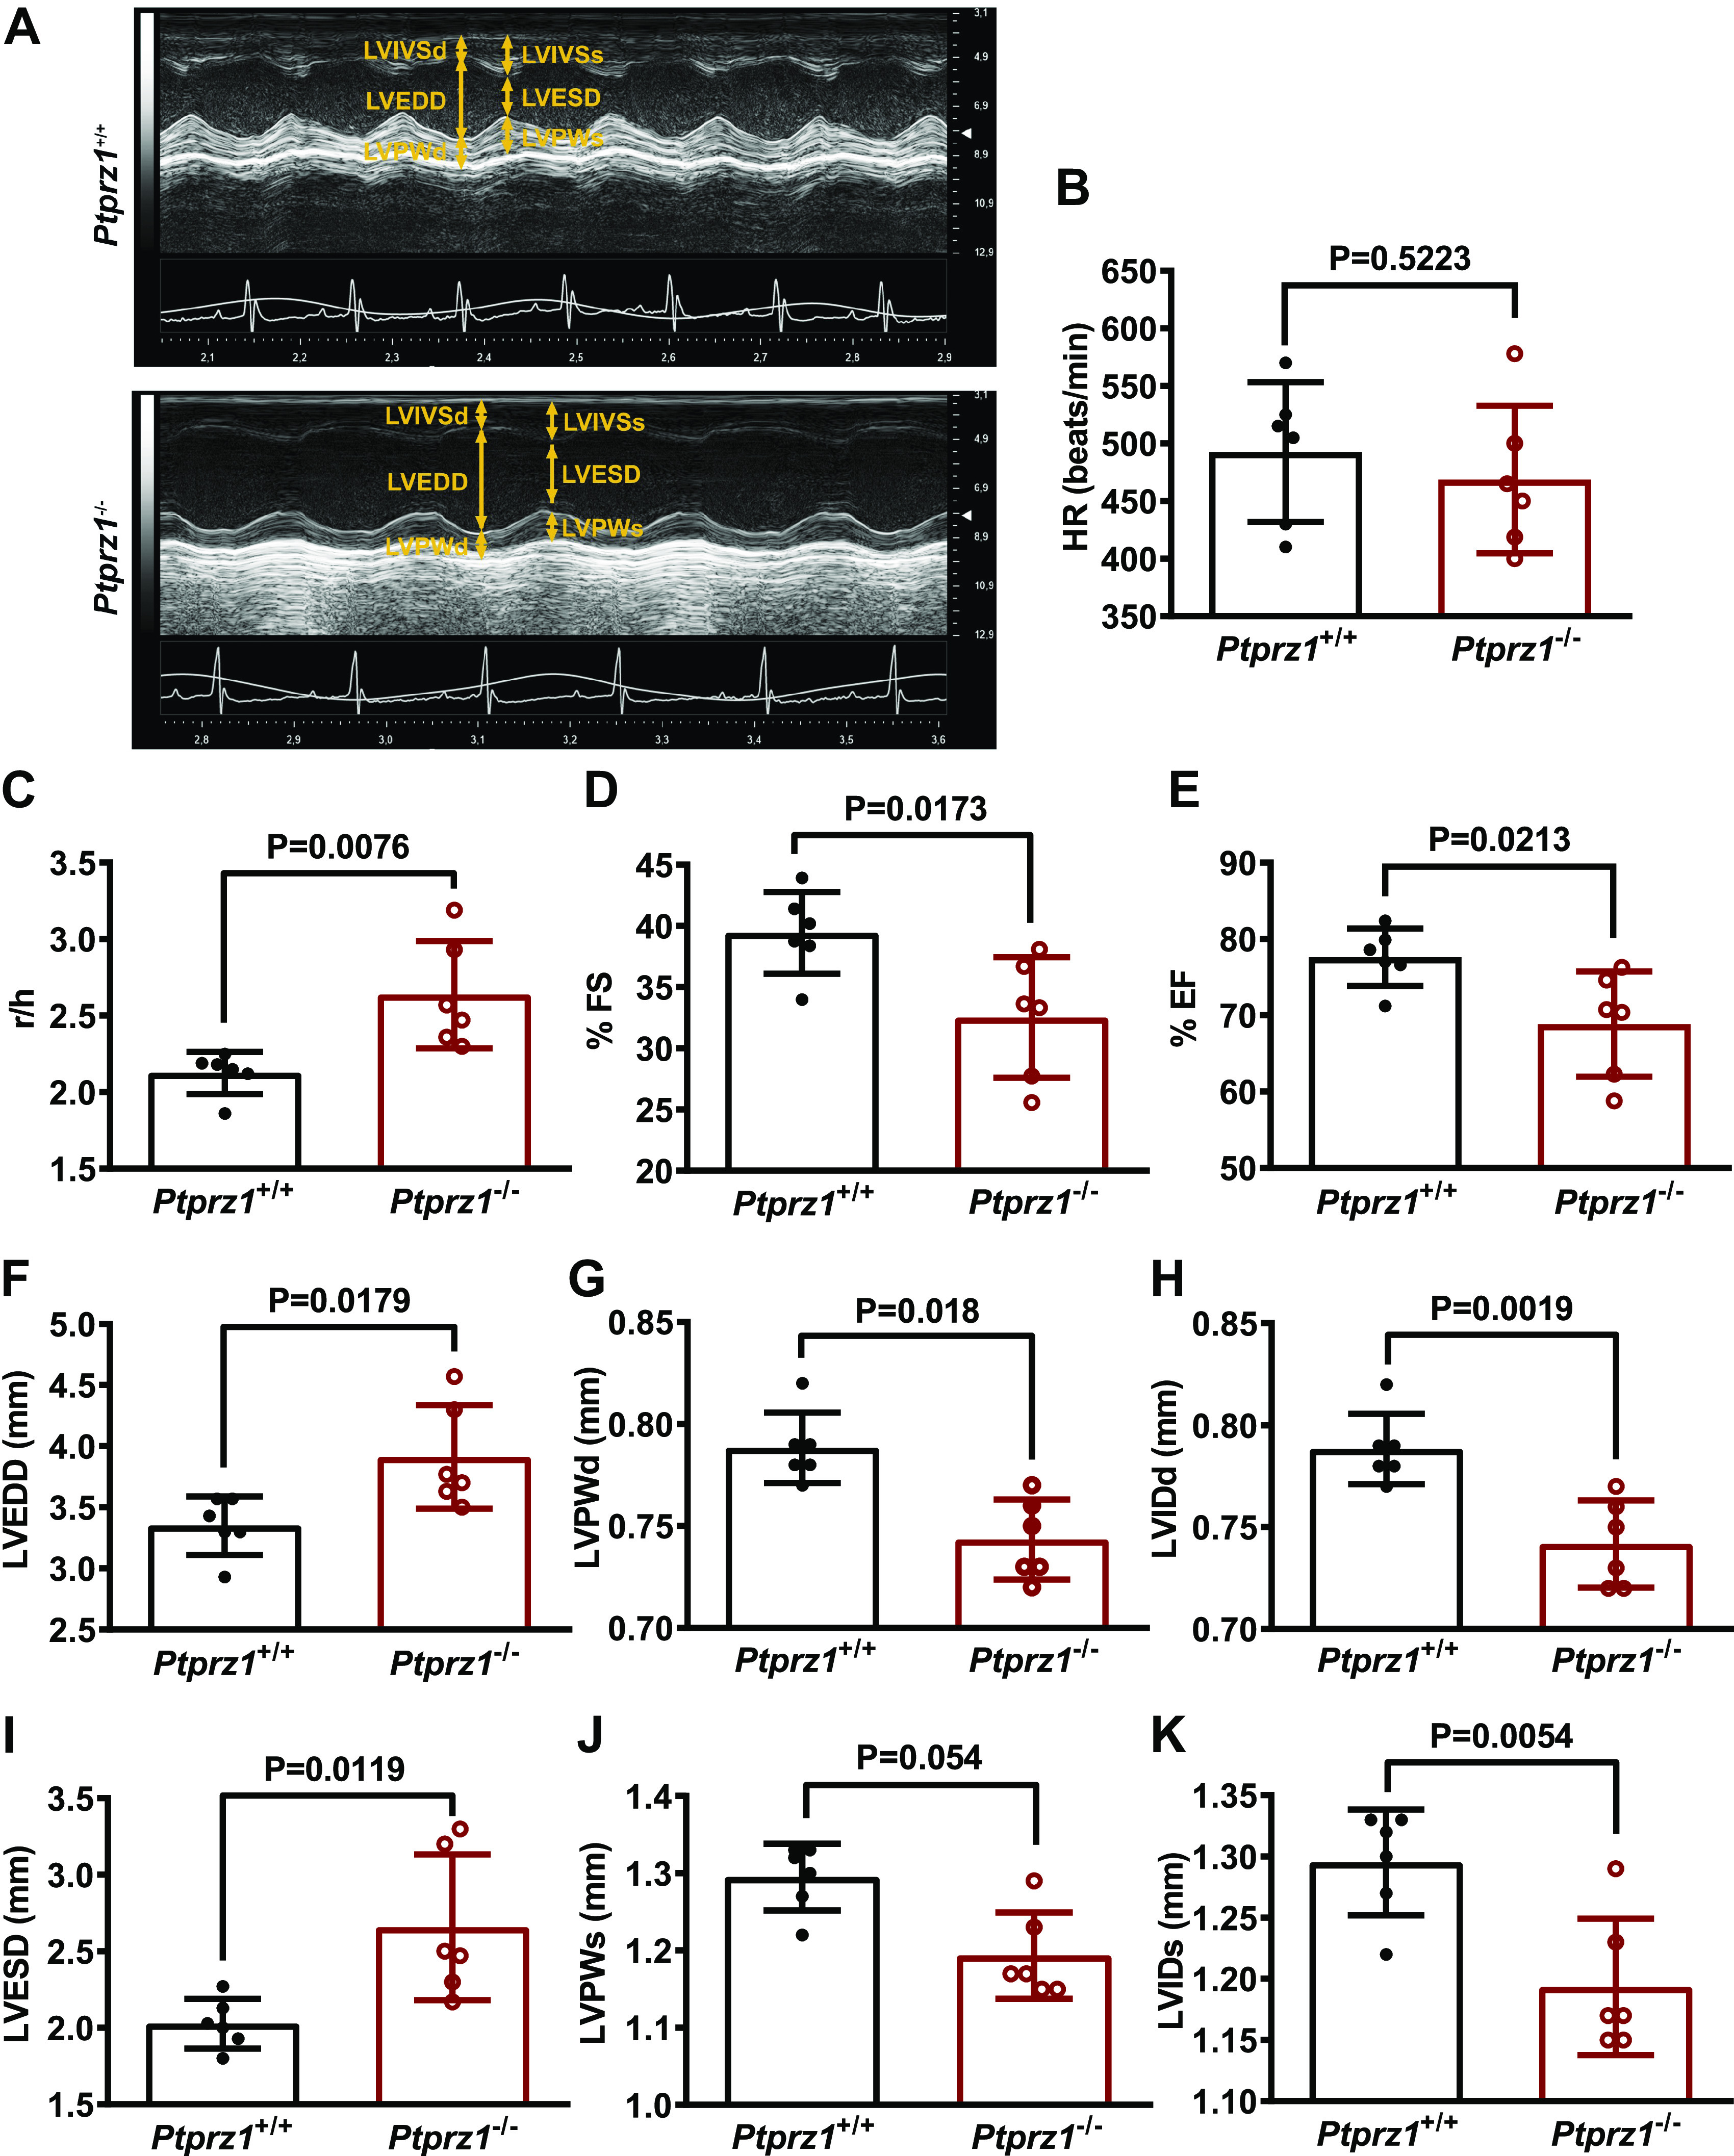
Fig. 1
Cardiac ultrasound in Ptprz1−/− and Ptprz1+/+ mouse hearts. A: representative cardiac ultrasound images of the LV at the level of the papillary muscle before the mitral valve. These are short axis mode images, which show from above to below the interventricular wall, the cavity, and the posterior wall of the left ventricle. B–K: quantitative data derived from such images are shown and data in all cases are expressed as means ± SD from 6 Ptprz1−/− and 6 Ptprz1+/+ mice at the age of 3 mo. Statistical analysis was performed by Student’s unpaired t test. HR, heart rate; LV, left ventricle; LVEDD, left ventricular end-diastolic diameter; LVESD, left ventricular end-systolic diameter; LVIDd, left ventricular internal dimension at end-diastole; LVISd, left ventricular internal dimension at end systole; LVPWd, left ventricular posterior wall thickness at end-diastole; LVPWs, left ventricular posterior wall thickness at end systole; %EF, percent ejection fraction; %FS, percent fractional shortening; r/h, left ventricular radius to left ventricular posterior wall thickness ratio.