
- Title
-
Panx1b Modulates the Luminance Response and Direction of Locomotion in the Zebrafish
- Authors
- Safarian, N., Houshangi-Tabrizi, S., Zoidl, C., Zoidl, G.R.
- Source
- Full text @ Int. J. Mol. Sci.
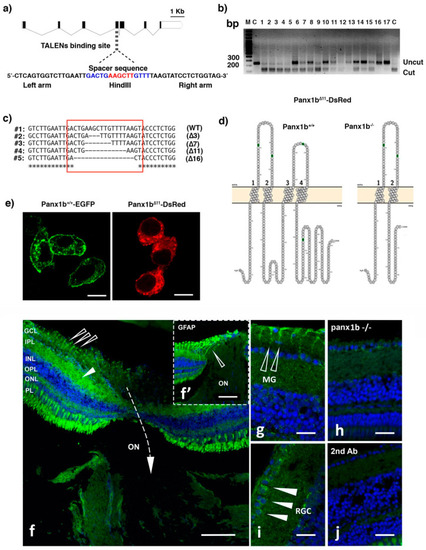
Figure 1. Generating panx1b−/− fish using TALENs. (a) Cartoon depicting the zebrafish panx1b gene structure with seven coding exons. The left and right TALENs binding sequence with the spacer sequence and HindIII restriction site in blue and red is highlighted. (b) The RFLP-assay shows the loss of the HindIII recognition sequence (uncut) in fourteen out of seventeen F0 larvae tested. (c) The sequence alignment demonstrates small (3 to 16 bp) deletions causing frameshift mutations (in red box) in four different F0 larvae. (d) The Protter open-source tool (wlab.ethz.ch/protter, 20 July 2020) visualized the predicted topology of the wild type and mutant Panx1b proteins. The 11 bp deletion in panx1b exon 4 resulted in a frameshift causing a premature stop codon at amino acid E179. (e) Localization of the truncated Panx1b protein–Confocal images of transiently transfected Panx1b+/+-EGFP (left panel) and Panx1bΔ11-DsRed-monomer (right panel) proteins in Neuro2a cells. Scale bar: 10 μm. (f) Panx1b immunoreactivity in the adult retina of TL fish. The section represents the retina at the contact point with the optic nerve (ON). The closed triangle points at Panx1b staining in the inner plexiform layer (IPL). The open triangle represents Panx1b immunoreactivity in end-feet of Muller glia. The inset (f’) shows GFAP-stained Muller glia in the same region of a consecutive slice of the retina indicated by an open triangle. (g) Open arrows point at Panx1b-positive Muller glia end feet. (h) Closed triangles point at Panx1b positive retinal ganglion cells. (i) Lack of significant Panx1b immunoreactivity in the adult panx1b−/− retina. (j) Control with 2nd antibody only. Please note that the gain of the green channel in images (i,j) was enhanced to visualize the background staining. Abbreviations: WT, wild type TL; GCL, ganglion cell layer; IPL, inner plexiform layer; INL, inner nuclear layer; OPL, outer plexiform layer; ON, optic nerve. Scale bars: (f,f’) = 100 µm; (g,h) = 25 µm; (i,j) = 20 µm.
|
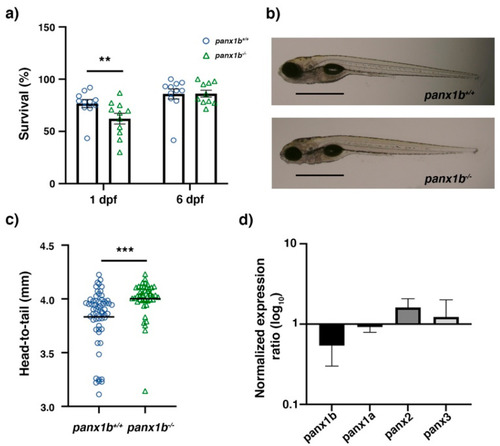
Figure 2. Primary characterization of panx1b−/− larvae. (a) Survival rate at 24 h and six days post-fertilization (1 dpf, 6 dpf). (b) Morphology of age-matched TL control and panx1b−/− larvae (at 6dpf) showing regular anatomical features. Scale bar = 100µm. (c) Head-to-tail size measurement of panx1b−/− and control TLs (6 dpf). (d) RT-qPCR analysis of pannexin gene expression in 6dpf larvae. Significance: ** p < 0.01 and *** p < 0.001; nd: Not detected. Error bars = SEM.
|
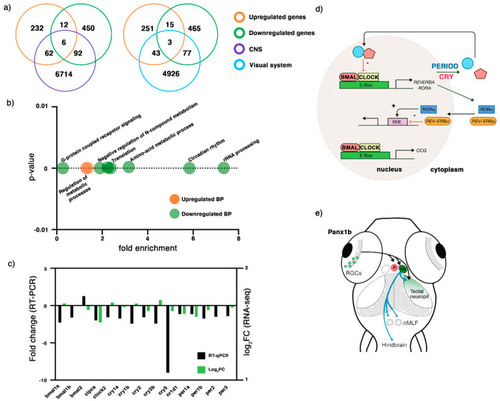
Figure 3. RNA-seq analysis of 6dpf panx1b−/− larvae. (a) Comparison of differentially regulated RNA transcripts against two categories: central nervous system (CNS) and the visual system. (b) GO annotation of RNA-seq data in terms of biological process (BP): the upregulated RNA transcripts were enriched in the regulation of metabolic processes, whereas the downregulated genes were annotated for RNA processing, circadian rhythms, amino-acid metabolic process, translation, negative regulation of nitrogen (N) compounds metabolism, and G-protein coupled receptor signaling. (c) Validation of RNA-seq data by RT-qPCR. The significant downregulation of cry1, cry5, bmal1a, bmal1b, and clock2 genes in 6 dpf panx1b−/− larvae was confirmed by RT-qPCR in n = 3 independent replicates. (d) Cartoon illustrating the network of circadian clock genes differently regulated in panx1b−/− larvae. Regulated genes in bold. (e) Illustration of the connection of the inner retina with optic tectum, habenula (Ha), and pretectum (p) conferring light sensitivity and circadian rhythmicity, and descending control of locomotion. Abbreviation: nMLF, nucleus of the medial longitudinal fasciculus.
|
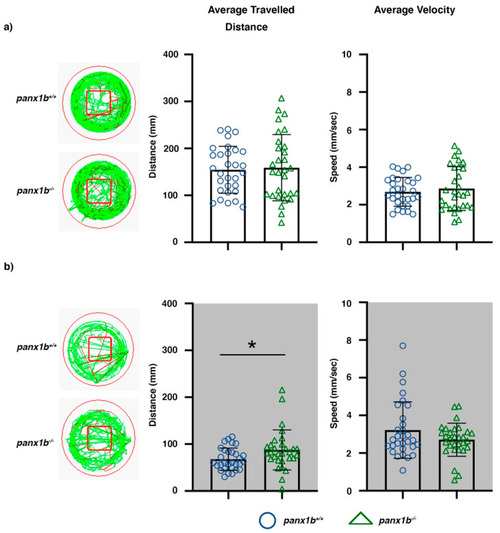
Figure 4. Locomotor activity in Light-ON and Light-OFF conditions. Locomotion was video tracked for 60 min in (a) Light-ON and (b) Light-OFF conditions. The wells on the left show examples of the locomotion patterns of panx1b−/− and panx1b+/+ (TL control) larvae at 6 dpf. Medium (<20 mm/s) or high-speed movements (>20 mm/s) were visualized with green and red colors. The red square marks the region of interest used for assessment of the average distance travelled in the central zone. Graphs demonstrate the averaged traveled distance (in mm) and the average velocity (mm/s) of n = 30 larvae for each genotype. A Welch’s t-test was used for statistical comparison of groups. Significance: * = p-value < 0.05. Error bars = SEM.
PHENOTYPE:
|
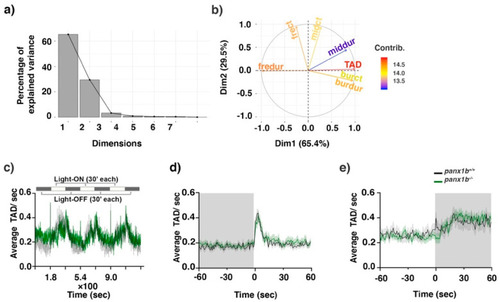
Figure 5. Visual-motor motor response (VMR) changes in panx1b−/− larvae at 6dpf. (a) Principal component analysis (PCA) transforming the VMR multidimensional data. The scree plot shows that Dimensions 1 and 2 capture more than 65.4% and 29.5% of the data variance. (b) The variable correlation plot represented the coordinates of the variables in the first two dimensions. The variables were colored from blue to red as their contribution to PCs increases. Total activity duration (TAD; in color red) showed the highest contribution to the variability in Dimension 1 and was chosen to visualize differences between genotypes. (c) The outline of the experimental paradigm is shown on top. The line graph shows the average TAD of panx1b−/− and panx1b+/+ (TL) larvae from a representative test with n = 24 larvae for each genotype. The activity was defined as the fraction of frames per second that a larva spent swimming (see methods for the detailed information). (d,e) The results for average Light-ON and Light-OFF VMR are shown from 1 min before the light switch to 1 min after the light switch. The color ribbons surrounding the average activity line graph correspond to 1 S.E.M. The values are the average of the second trial from four independent tests with n = 48 larvae for each genotype. The Light-ON and Light-OFF periods are indicated by white and black bars at the top of the panels. The “nparcomp” analysis was used for multiple comparisons and simultaneous confidence intervals.
PHENOTYPE:
|
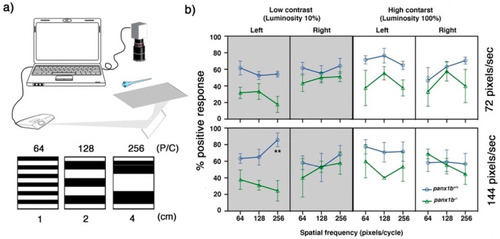
Figure 6. Optomotor response (OMR) declines in the absence of functional Panx1b. (a) The OMR setup. Three spatial frequencies at two different speed rates and two luminosity levels were used to assess larval zebrafish’s visual acuity. P/C = pixel/cycle (b) The percentage of positive response (% PPR) explains the average number of larvae that responded to a particular setting. The PPR values for each setting are the average of four tests ± SEM. In all tested settings, panx1b−/− were able to elicit an appropriate response, as observed in TL controls. However, their visual acuity was lower than controls when the direction of motion was towards the left. The difference between genotypes’ PPR for the left-ward motion became very significant at a spatial frequency of 256, with a speed of 144, and a low contrast setting (n = 40). The “lm” and the model statistical “summary” functions were used to fit a regression model. The significant differences were calculated using the “TukeyHSD” function in R. Significance: ** p-value < 0.01. Error bars = SEM.
PHENOTYPE:
|

ZFIN is incorporating published figure images and captions as part of an ongoing project. Figures from some publications have not yet been curated, or are not available for display because of copyright restrictions. |