
Image
|
Figure Caption
Figure 4
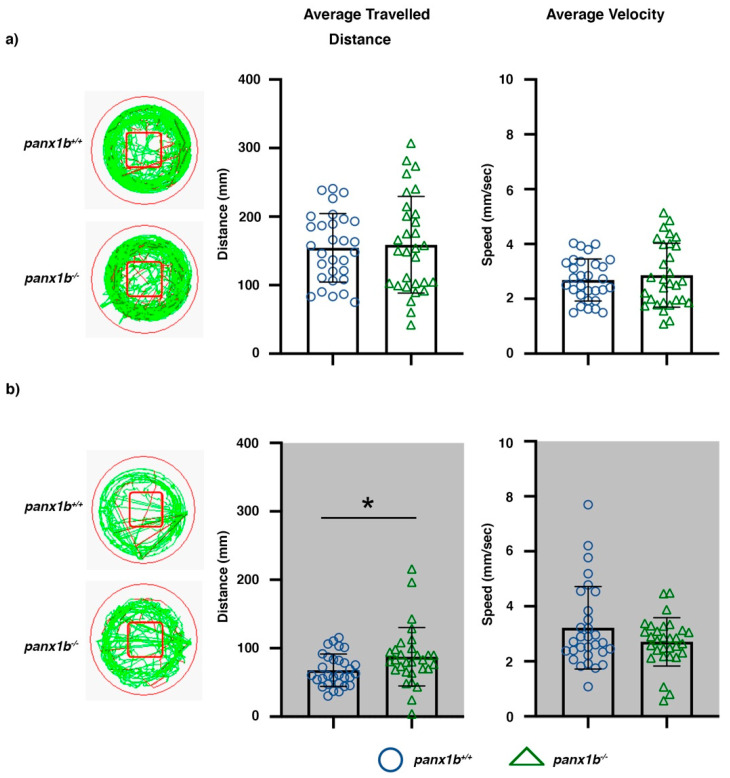
Figure 4. Locomotor activity in Light-ON and Light-OFF conditions. Locomotion was video tracked for 60 min in (a) Light-ON and (b) Light-OFF conditions. The wells on the left show examples of the locomotion patterns of panx1b−/− and panx1b+/+ (TL control) larvae at 6 dpf. Medium (<20 mm/s) or high-speed movements (>20 mm/s) were visualized with green and red colors. The red square marks the region of interest used for assessment of the average distance travelled in the central zone. Graphs demonstrate the averaged traveled distance (in mm) and the average velocity (mm/s) of n = 30 larvae for each genotype. A Welch’s t-test was used for statistical comparison of groups. Significance: * = p-value < 0.05. Error bars = SEM.
Figure Data
Acknowledgments
This image is the copyrighted work of the attributed author or publisher, and
ZFIN has permission only to display this image to its users.
Additional permissions should be obtained from the applicable author or publisher of the image.
Full text @ Int. J. Mol. Sci.