
FIGURE
Figure 1
- ID
- ZDB-FIG-211120-118
- Publication
- Safarian et al., 2021 - Panx1b Modulates the Luminance Response and Direction of Locomotion in the Zebrafish
- Other Figures
- All Figure Page
- Back to All Figure Page
Figure 1
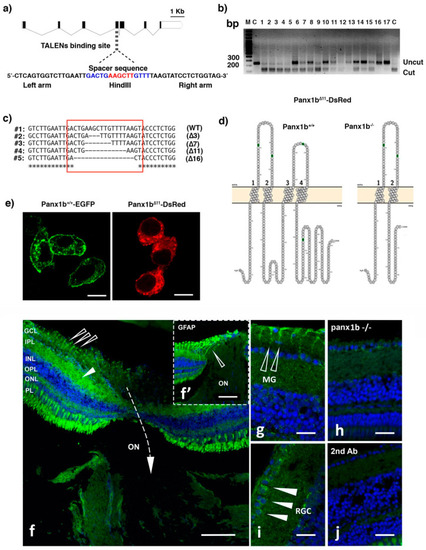
Figure 1. Generating panx1b−/− fish using TALENs. (a) Cartoon depicting the zebrafish panx1b gene structure with seven coding exons. The left and right TALENs binding sequence with the spacer sequence and HindIII restriction site in blue and red is highlighted. (b) The RFLP-assay shows the loss of the HindIII recognition sequence (uncut) in fourteen out of seventeen F0 larvae tested. (c) The sequence alignment demonstrates small (3 to 16 bp) deletions causing frameshift mutations (in red box) in four different F0 larvae. (d) The Protter open-source tool (wlab.ethz.ch/protter, 20 July 2020) visualized the predicted topology of the wild type and mutant Panx1b proteins. The 11 bp deletion in panx1b exon 4 resulted in a frameshift causing a premature stop codon at amino acid E179. (e) Localization of the truncated Panx1b protein–Confocal images of transiently transfected Panx1b+/+-EGFP (left panel) and Panx1bΔ11-DsRed-monomer (right panel) proteins in Neuro2a cells. Scale bar: 10 μm. (f) Panx1b immunoreactivity in the adult retina of TL fish. The section represents the retina at the contact point with the optic nerve (ON). The closed triangle points at Panx1b staining in the inner plexiform layer (IPL). The open triangle represents Panx1b immunoreactivity in end-feet of Muller glia. The inset (f’) shows GFAP-stained Muller glia in the same region of a consecutive slice of the retina indicated by an open triangle. (g) Open arrows point at Panx1b-positive Muller glia end feet. (h) Closed triangles point at Panx1b positive retinal ganglion cells. (i) Lack of significant Panx1b immunoreactivity in the adult panx1b−/− retina. (j) Control with 2nd antibody only. Please note that the gain of the green channel in images (i,j) was enhanced to visualize the background staining. Abbreviations: WT, wild type TL; GCL, ganglion cell layer; IPL, inner plexiform layer; INL, inner nuclear layer; OPL, outer plexiform layer; ON, optic nerve. Scale bars: (f,f’) = 100 µm; (g,h) = 25 µm; (i,j) = 20 µm.
|
Expression Data
| Gene: | |
|---|---|
| Antibodies: | |
| Fish: | |
| Anatomical Terms: | |
| Stage: | Adult |
Expression Detail
Antibody Labeling
Phenotype Data
| Fish: | |
|---|---|
| Observed In: | |
| Stage: | Adult |
Phenotype Detail
Acknowledgments
This image is the copyrighted work of the attributed author or publisher, and
ZFIN has permission only to display this image to its users.
Additional permissions should be obtained from the applicable author or publisher of the image.
Full text @ Int. J. Mol. Sci.